Go Profiling in Production

At Oodle, we use Golang for our backend services. In an earlier blog post (Go faster!), we discussed optimization techniques for performance and scale, with a specific focus on reducing memory allocations. In this post, we'll explore the profiling tools we use. Golang provides a rich set of profiling tools to help uncover code bottlenecks.
Our Setup
We use the standard net/http/pprof package to register handlers for profiling endpoints. As part of our service startup routine, we run a profiler server on a dedicated port.
import (
  _ "net/http/pprof"
)
...

var profilerPort = flaggy.GetEnvStringVar(
  "PROFILER_PORT",
  "profiler_port",
  "Profiler port",
  "6060",
)

func StartProfilerServer(ctx context.Context) {
  go func() {
    http.ListenAndServe(fmt.Sprintf("localhost:%s", *profilerPort), nil)
  }()
}
This setup allows us to collect various profiles exposed by the net/http/pprof package on-demand.
CPU Profiling
CPU profiling helps understand where CPU time is being spent in the code. To collect a CPU profile, we can hit the /debug/pprof/profile endpoint with a seconds parameter.
curl http://localhost:6060/debug/pprof/profile?seconds=30 -o cpu.prof
After collecting the profile, we can analyze it using the go tool pprof command.
go tool pprof -http=:8080 cpu.prof
Note:
Both of the above steps can be combined into a single command:go tool pprof -http=:8080 http://localhost:6060/debug/pprof/profile?seconds=30
This command starts a local HTTP server and opens the profile in the browser. We frequently use [flame graphs] (https://www.brendangregg.com/flamegraphs.html) for profile analysis.

Note:
All screenshots referenced in this blog post are for the demo application.
Per-tenant profiles in a multi-tenant service
As a multi-tenant SaaS platform, Oodle serves many tenants from the same deployment. Ingestion and query loads vary significantly among tenants. To understand CPU profiles for individual tenants, we use [profiler labels] (https://rakyll.org/profiler-labels/) to add tenant identifiers to the profiles.
pprof.Do(ctx, pprof.Labels("tenant_id", tenantID), func(ctx context.Context) {
  // Your code here.
})
These profiler labels attach additional information to stack frames in the collected profiles, enabling per-tenant CPU attribution analysis.
$ go tool pprof cpu.prof
File: cpu
Type: cpu
...
(pprof) tags
 tenant_id: Total 10.6s
            6.7s (63.31%): tenant1
            3.9s (36.69%): tenant2
We can also use the tagroot argument to add the tenant identifier as a pseudo stack frame at the callstack root.
go tool pprof -http=:8080 -tagroot tenant_id cpu.prof

Memory Profiling
Memory profiling helps identify where memory allocations occur. Since Golang is a memory-managed language, minimizing allocations is crucial for reducing Garbage Collection (GC) overhead. Using our profiler server, we can collect a memory profile via the /debug/pprof/heap endpoint.
go tool pprof -http=:8080 http://localhost:6060/debug/pprof/heap

Note:
Collecting memory profiles at different times and comparing them helps understand the service's memory behavior. Use the-diff_baseflag to compare two profiles:go tool pprof -http=:8080 -diff_base heap_0935.prof heap_0940.prof
Automated Memory Profiling
Memory footprint of a program can vary significantly depending on the workload. If the memory allocation rate is higher than the Garbage Collection (GC) rate, it can lead to Out of Memory (OOM) crashes. To understand memory usage patterns during high-memory situations, we use an auto profiler that:
- Captures memory profiles when footprint exceeds a percentage threshold
- Uploads these profiles to object storage for offline analysis
- Rate-limits profile collection to prevent excessive uploads
Here is a rough blueprint of the auto profiler:
import (
  "runtime/metrics"
  "pontus.dev/cgroupmemlimited"
)

func startAutoProfiler(ctx context.Context) error {
  memSamples := make([]metrics.Sample, 2)
  memSamples[0].Name = "/memory/classes/total:bytes"
  memSamples[1].Name = "/memory/classes/heap/released:bytes"

  profileLimit := cgroupmemlimited.LimitAfterInit * (*autoProfilerPercentageThreshold / 100)

  go func() {
    ticker := time.NewTicker(*profilerInterval)
    for {
      select {
        case <-ctx.Done():
          return
        case <-ticker.C:
          metrics.Read(memSamples)
          inUseMem := memSamples[0].Value.Uint64() - memSamples[1].Value.Uint64()

          if inUseMem > profileLimit {
            if !limiter.Allow() { // rate limiter
              continue
            }

            var buf bytes.Buffer
            if err := pprof.WriteHeapProfile(&buf); err != nil {
              continue
            }

            // Upload the profile to object storage
          }
      }
    }
  }()
}
Goroutine Analysis
While Golang makes concurrent programming easier with its powerful concurrency primitives like Goroutines and Channels, it's also possible to introduce goroutine leaks. For examples of common goroutine leak patterns, see this blog post.
We use goleak to detect goroutine leaks in our tests. Enable it in a test by adding a TestMain function at the package level:
func TestMain(m *testing.M) {
  goleak.VerifyTestMain(m)
}
To collect a goroutine dump from our services, we can use the debug/pprof/goroutine endpoint:
curl "http://localhost:6060/debug/pprof/goroutine?debug=2" -o goroutine.dump
The goroutine dump is a text file containing stack traces of all process goroutines. For analyzing dumps with thousands of goroutines, we use goroutine-inspect, which provides helpful deduplication and search functionality.
Execution Tracing
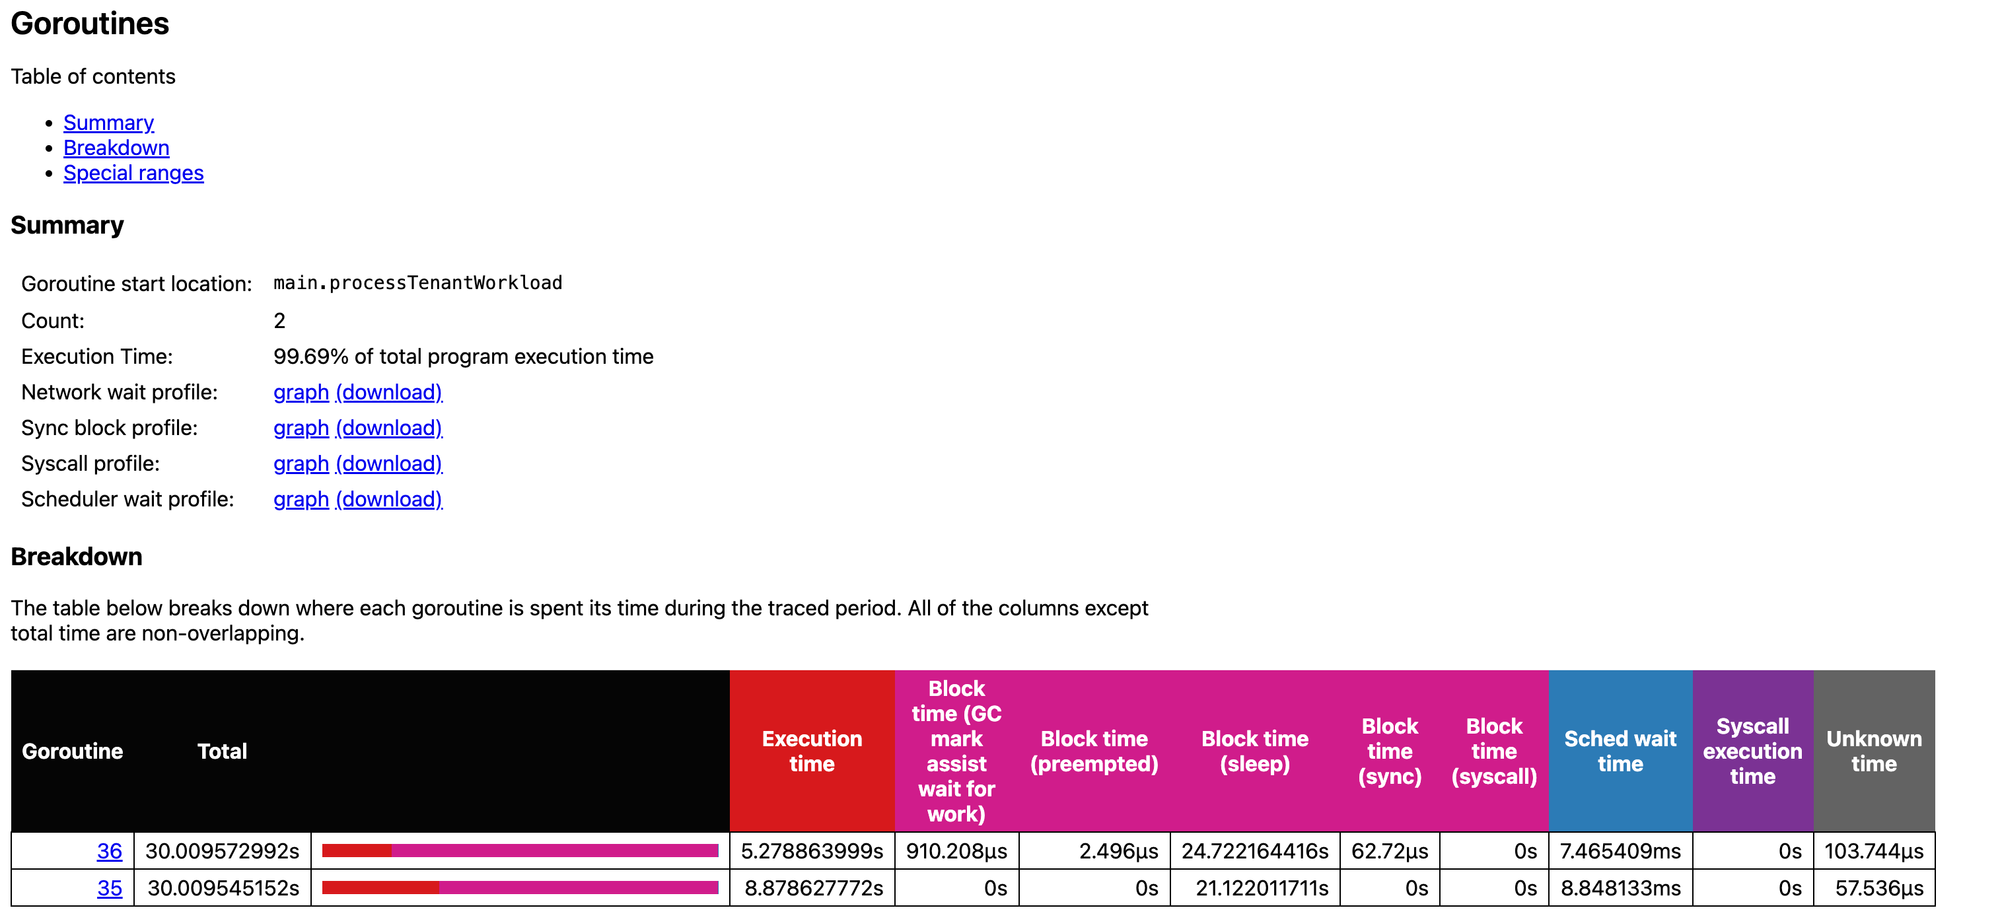
Execution tracing helps you understand how goroutines are scheduled and where they might be blocked. It captures several types of events:
- Goroutine lifecycle (creation, start, and end)
- Blocking events (syscalls, channels, locks)
- Network I/O operations
- System calls
- Garbage collection cycles
While CPU profiling shows which functions consume the most CPU time, execution tracing reveals why goroutines might not be running. It helps identify if a goroutine is blocked on a mutex, waiting for a channel, or simply not getting enough CPU time. For a comprehensive introduction to execution tracing, see this blog post.
To collect an execution trace, use the debug/pprof/trace endpoint:
curl "http://localhost:6060/debug/pprof/trace?seconds=30" -o trace.prof
To analyze the collected trace, use the go tool trace command:
go tool trace trace.prof

Recent versions of Go have significantly reduced the overhead of execution tracing, making it practical for use in production environments.
Summary
In this post, we explored Golang's profiling tools and how we use them at Oodle to build our high-performance metrics observability platform.
Experience our scale firsthand at play.oodle.ai. Our playground processes over 13 million active time series per hour and more than 34 billion data samples daily. Start exploring all features with live data through our Quick Signup.
Join Our Team
Are you passionate about building high-performance systems and solving complex problems? We're looking for talented engineers to join our team. Check out our open positions and apply today!

