
Dashboards are Dead!

TL;DR
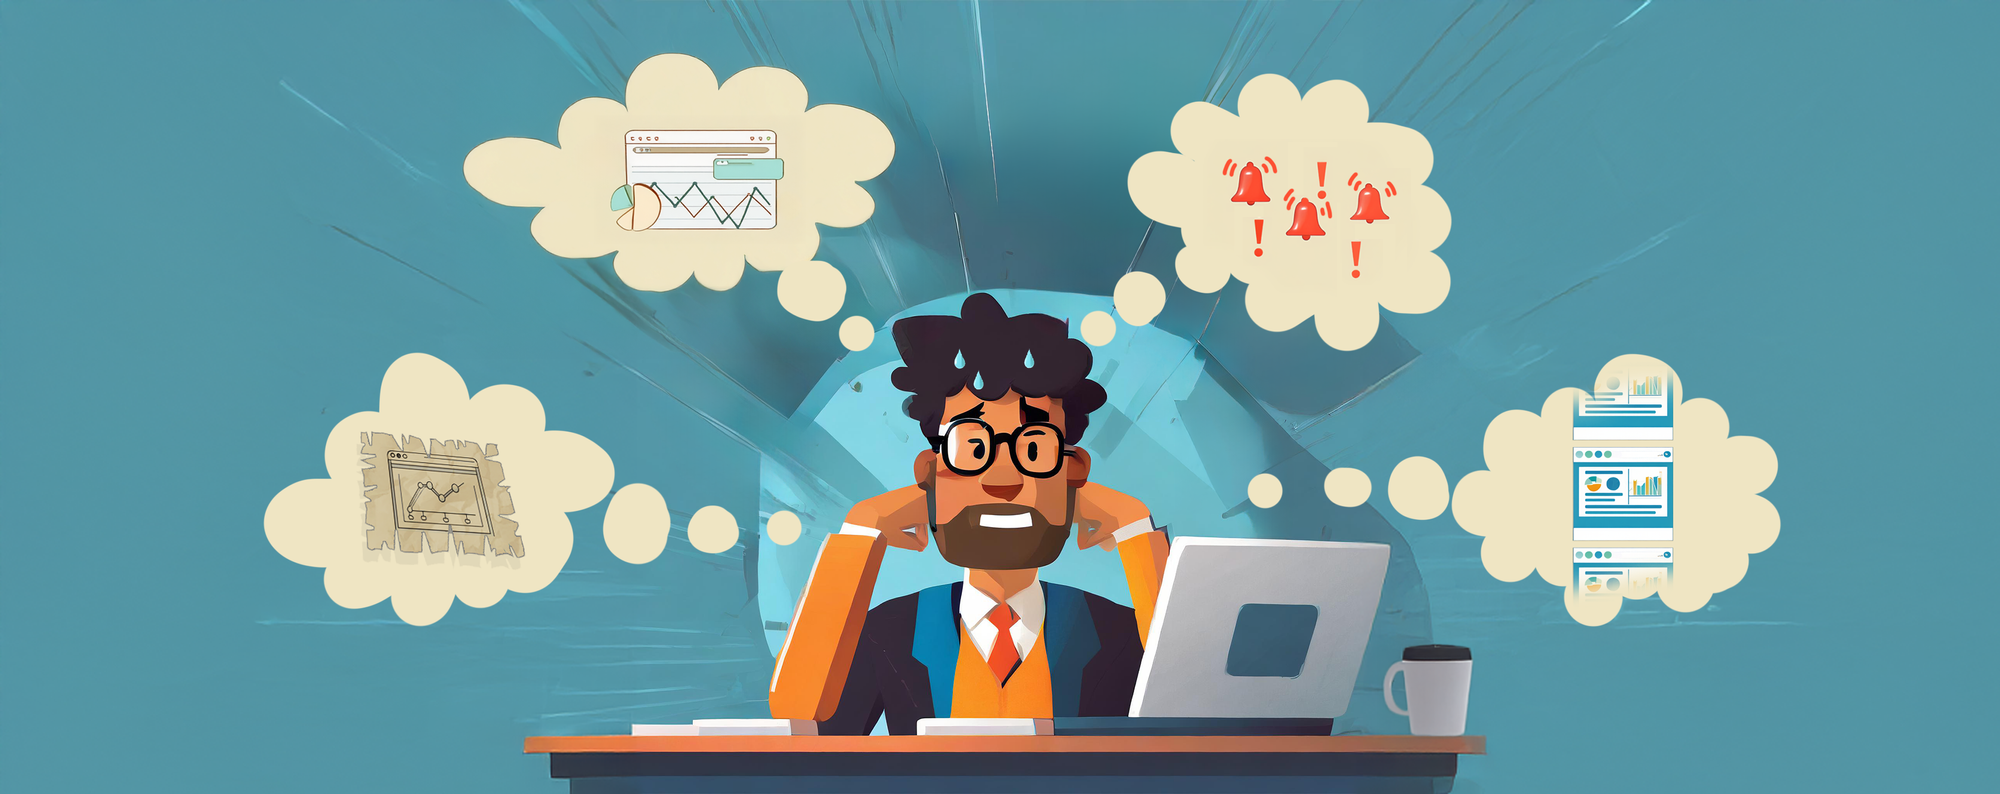
The static, pre-built dashboard is dead. The always-on wallboard you build by hand, then maintain through every reorg and schema change, no longer keeps up.
What isn't dead is the view itself: it stops being something you make in advance and becomes something your observability system assembles on demand, for the incident in front of you, and throws away afterward.
The shift has four parts, and the rest of this post makes the case for each:
- Dynamic instrumentation — telemetry collected automatically, not wired by hand
- Dynamic alerts — surfaced from the data instead of pre-configured thresholds
- Dynamic dashboards — views generated for the incident, then discarded
- Dynamic debugging — the system correlates signals and proposes the diagnosis
Say you are a modern software engineer used to getting access to relevant information at your fingertips, you are grappling with questions around your Observability tools:
“Why am I still relying on static dashboards in an era where everything else is dynamic and easy to use?”
“Why is my work day just filled with creating and updating metric dashboards for triaging incidents?”
“Are pre-built dashboards just relics of the past, limiting real-time decision making?”
“Can Metric dashboards be ephemeral - created, used and discarded dynamically - just like logs and traces?”
You have started thinking about these as you have just finished your on-call rotation where the same story has unfolded for the umpteen times, which looks something like this:

The above itself looks quite daunting, however, in reality, there are few more hurdles which you may face depending on the state of Observability, Deployment systems, and organization size and practices at your company:
- Alert Fatigue: you may be late at reacting to the above alert which is genuinely critical amidst a bunch of alert noise due to false positives in existing alerts. This could result in a bunch of Customer support tickets going to Support organization and Support engineers parallely spending time to resolve those support tickets.
- Missing Observability: Above assumes you have all relevant metrics, logs, traces available in easily queryable form. However, in reality, you may have missing signals (do you have metrics/logs/traces at your company?), missing instrumentations (do you have relevant instrumentation to emit metrics/logs/traces at critical paths), non-standard instrumentation (does your metrics/logs/traces follow standard conventions to be able to cross-correlate them?) making it difficult to look across different services.
- Observability Tools Expertise: We saw the need to tweak existing dashboards, perform ad hoc queries in the above investigation. This requires engineers to master various Observability tools (best of luck if you have multiple Observability tools in your organization) and be familiar with using them quickly. Each minute during the investigation is crucial and you don’t have time to go through User Manuals in the middle of a production debugging.
- Change Management Tools: To be able to know recent upgrades, hotfixes, config changes, feature flag toggles etc., you need to have good change management practices being followed at the organization level. Without having access to change events from your deployment system, you are missing crucial information for your debugging in an ever-changing environment guided by Continuous Deployment philosophy.
- Organizational Hierarchy: In the complex modern applications having a myriad number of microservices, no single engineer would have full context on all the services. Conway’s Law typically governs how the system is broken down in services - your services structure would look very similar to your organizational structure. This adds more communication overhead in above debugging, as you would need to engage with multiple teams to troubleshoot the issue.
- And lastly, Human Intelligence: It is not uncommon to see more experienced engineers at the company being able to debug production incidents much faster than new joiners in the team, Or to have a know-all Platform engineer who gets looped into almost all production outages. As the above journey highlights, debugging a production incident is all about looking at various sources of data, forming hypotheses, connecting the dots until you can validate one of the hypotheses. Debugging is an art of establishing causal relationships and being cautious of not interpreting correlations as causations.
Dashboards are Dead!
OnCall burnout is a real problem and it grows as the size of your organization grows. The Observability journey at any company starts modestly with when the scale is low and it is sufficient to monitor the entire system via a handful of static dashboards. Subsequently, you start creating relevant alerts to notify you when things go wrong. As the company grows, the number of deployments/services grows and your observability dashboards start to follow Conway’s Law - each team starts maintaining their own set of dashboards to monitor their frequently visited metrics. As the company further grows, a central Platform/SRE team gets established who starts to introduce a much-needed hygiene towards standardisation of common metrics, dashboards and alerts. Subsequently, a tight-rope balancing act starts in multiple dimensions - ease of debuggability v/s managing the costs, availability & reliability v/s alert noise, feature development v/s on-call bandwidth, and so on.
We ask a simple question - does every company need to go through a similar Observability journey? What happens when you don’t take a dashboard-first, alert-first approach and rather expect your Observability tools to not just provide you with building blocks which let you monitor your systems availability and reliability, but rather expect Observability tools to monitor your systems availability and reliability and help you troubleshoot when these get impacted. The ultimate value of Observability data is to know when your system's availability/reliability is impacted and being able to troubleshoot and mitigate it faster.
Let us try to answer these questions by listing the core components which will be needed to break free from the current way of using Observability tools.
Dynamic Instrumentation
“Wouldn’t it be great to have relevant telemetry data collected automatically and always?”
Collecting observability data from your systems should not be a day-1 problem, adding instrumentation to your service should not be a release-readiness task to be completed after the entire feature is built. OpenTelemetry’s auto-instrumentation uses eBPF to automatically collect Observability data from your applications. eBPF based auto-instrumentation removes the reliance on developers to instrument the applications which helps in standardisation of observability data as well as comprehensive collection of observability data. https://ebpf.io/applications/ provides a rich set of applications built on top of eBPF - some of them being related to Observability.
Dynamic instrumentation also allows to ensure that telemetry data is consistent across various signals - metrics/logs/traces etc. Removing reliance on developers to instrument the applications means that we can apply standardised semantic conventions at the source of the data generation.
Dynamic Alerts
“Why can’t my Observability tool tell me when my systems are unhealthy?”
In today’s Observability systems, alert definitions are static. As an engineer, you define what you want to get alerted on, what thresholds to set, which channels to be notified on? This worked well when you had monolithic applications with their associated Ops teams as it was all under the purview of the Ops team - they were both the creators as well as recipients of alerts. With the modern cloud-native microservice architectures, though static alert definitions don’t suffice. In the example alert investigation shared at the beginning of this post, wouldn’t it save so much time and effort if an alert is raised on marketing-service which introduced an excessive load on promotions-service. As the complexity of modern applications increases, you need a birds-eye view of what’s unhealthy at the current point of time. Netflix’s Telltale comes to my mind of how an intelligent alerts system could look like.
Dynamic Dashboards
“Is the future of Observability dashboard-less? What does it look like?”
A dynamic dashboard is one your observability platform builds on the fly for the question you're actually asking, the incident, the deploy, the degraded service, and then discards. It's the opposite of the pre-built wallboard you maintain forever: no dashboard sprawl, no stale panels, no "which of our 400 dashboards shows this?"
Modern applications have cloud-native architectures where the infrastructure itself is dynamic - your pods scale up/down based on incoming load, you can spin up your clusters in a different cloud/region quickly. In such a world, why are we still relying on static dashboards to be created and maintained? With the amount of Observability data increasing, static dashboards only show a tip of the iceberg, most of your observability data is not visible in these static dashboards and continue to remain hidden as engineers find it friction-full to create or update these static dashboards. Wouldn’t it be great to have access to all your observability data at your fingertips? The recent advancements in AI and LLMs show promise to change the way we consume Observability data - now you can just type in what you want to see and Observability tools should be able to understand your intent and show you relevant data within seconds.
Dynamic Debugging
“Can AI-driven, context-aware debugging approaches replace traditional means of debugging altogether?”
Our current way of debugging an alert is primarily dependent on manually looking at various dashboards, logs, traces and connecting the dots. The runbooks associated with alerts are also static - most of the time they could be outdated or don’t cover the exact scenario which is happening for the current alert incident.
A recent report from PagerDuty shows that a large part of incident response tasks are still manual and extremely time consuming.

With a rich set of semantically correlated Observability data being available, one can apply ML/AI models to connect the dots and generate dynamic dashboards specifically catered to the incident being investigated. You should be able to look at the inter-connected web of telemetry data (metrics, logs, traces, service dependencies, upgrade history) in the context of the alert being triaged.
Where this stands in 2026. When this piece first argued the point, "dashboards are dead" was a provocation. A year on, it's close to the industry's working assumption, and it has a name: agentic observability. IBM now describes customers who "don't want a dashboard… they want an agent that answers the question directly," increasingly through an MCP server or CLI rather than a browser. Gartner projects 40% of enterprise applications will embed task-specific AI agents by the end of 2026, up from under 5% a year earlier. The provocation held up: the dashboard isn't being polished, it's being bypassed.
The honest caveat one year of hindsight buys: the debate has settled on demotion, not death. Even the loudest sceptics (Tableau, Hex, SquaredUp) land on "evolving, not dead," and CHI 2026 research warns of "conversational debt", insights that vanish into chat history with nothing durable to point back at. The static, hand-built dashboard is finished. A thin, shared surface, now generated and agent-driven, is not.
At the end, I would like to leave you with a question:
“Is the future of Observability dashboard-less? Will it be replaced by a dynamic, context-aware debugging experience?"
Are dashboards actually dead? A straight answer
Yes and no, and the distinction is the whole argument. The static, pre-built dashboard is dead: the always-on wallboard you assemble by hand and then maintain through every reorg, rename, and schema change cannot keep up with infrastructure that is itself dynamic. What replaces it isn't "no view", it's a dynamic view generated on demand for the incident you're actually chasing, then discarded. So when people ask "why are dashboards dead?", the precise answer is: they're dead as artifacts you build in advance, and alive as outputs your system produces in the moment.
What replaces the dashboard?
Not another tool you stare at, a set of capabilities that do the staring for you. In a dynamic observability model, four things replace the pre-built dashboard:
- Auto-collected telemetry (dynamic instrumentation): metrics, logs and traces gathered automatically via auto-instrumentation and eBPF, so the data is already there when you need it.
- System-driven alerts (dynamic alerts): the platform surfaces "this is unhealthy" from the data instead of firing thresholds you hand-tuned months ago.
- On-demand, incident-scoped views (dynamic dashboards): the view is generated for the question in front of you and thrown away after, ending dashboard sprawl.
- AI-driven root cause (dynamic debugging): correlated telemetry plus ML/AI to connect the dots, so debugging isn't manual panel-hopping.
Put together, the "dashboard" stops being a place you go and becomes an answer the system hands you.
When do dashboards still make sense?
Plenty of the time, which is why "dead" is a deliberate provocation, not a literal claim. A static dashboard still earns its keep in three cases:
- Shared coordination surfaces: a single wall an on-call team, an exec, and a customer can all point at during an incident. Agents answer your question; they don't give a room a common picture.
- Known, stable questions: golden-signal SLO views (latency, errors, saturation, traffic) that rarely change and benefit from always being on.
- Auditability: a durable, shareable artifact you can link to later, which a throwaway conversation can't provide (the "conversational debt" problem).
The point isn't to delete every dashboard. It's to stop defaulting to a hand-built, dashboard-first workflow for problems that dynamic instrumentation, alerts, and AI-driven debugging now solve better.
Static dashboards vs dynamic observability
The shift in one view:
| Static, pre-built dashboard | Dynamic observability | |
|---|---|---|
| Created | By hand, in advance | Generated on demand, per incident |
| Instrumentation | Manual, service-by-service | Automatic (auto-instrumentation, eBPF) |
| Alerts | Static thresholds you tune | System infers unhealthy state from the data |
| Lifecycle | Maintained forever; drifts stale | Used for the incident, then discarded |
| Debugging | Manual panel-hopping | AI-driven, context-aware root cause |
| Fails when | Infra changes faster than you update panels | Need a shared view that outlives the incident |
This is what "the dashboard is dead" actually means in practice: not zero views, but the end of the build-and-babysit model.
Key takeaways
- The static, pre-built dashboard is dead: hand-built wallboards can't track dynamic infrastructure.
- The view isn't dead, it goes dynamic: generated on demand for the incident, then discarded.
- Four moves define the shift: dynamic instrumentation, alerts, dashboards, and debugging.
- 2026's version of the argument is agentic observability: agents query the data (often via MCP/CLI); humans stop squinting at panels.
- Dashboards still matter as coordination and SLO surfaces: the change is dropping the dashboard-first default.
Frequently asked questions
Are dashboards dead?
The static, pre-built dashboard is; the view it produced is not. What's dying is the model of hand-building and maintaining dashboards in advance, replaced by dynamic, on-demand views generated for the incident at hand.
Why are dashboards dead?
Because modern infrastructure is dynamic, pods scale, clusters move, services churn, and a hand-maintained dashboard can't keep pace. Add alert fatigue, dashboard sprawl, and manual debugging, and the dashboard-first workflow breaks down.
What is replacing dashboards?
Dynamic observability: auto-collected telemetry, system-driven alerts, incident-scoped views generated on demand, and AI-driven debugging, increasingly delivered through agents rather than a screen you watch.
Is observability going dashboard-less?
Directionally, yes, in 2026 the label is agentic observability, where agents ask questions of the data via MCP servers or CLIs. Shared coordination and SLO views survive, but they're generated, not hand-built.
Can a platform spin up reliability dashboards without a ton of manual configuration?
That's exactly the point of dynamic dashboards, the system assembles the view from already-collected, semantically correlated telemetry instead of asking you to build and wire panels by hand.
How Oodle does this
Oodle is built dashboard-second: telemetry is collected automatically, alerts surface from the data, and views are generated for the incident you're on, no wall of dashboards to build or babysit. See how Oodle approaches AI-native observability →
Related reading