
Scaling Prometheus: How to Go From a Single Node to Enterprise-Grade Observability


TL;DR
- The problem: Prometheus is easy to run on one node, but its memory grows with every active time series, so a single server eventually hits a wall.
- The scaling paths for running Prometheus at scale, in order of effort: reduce cardinality first, then split load with functional sharding, add federation for an aggregate view, and move to remote storage when you need durability and one query view.
- The remote-storage verdict for 2026: Thanos to extend a working Prometheus fleet, Grafana Mimir for a new multi-team platform, VictoriaMetrics for the lightest operations. Cortex is maintained, but most new development happens in Mimir. Full comparison table below.
- New since this guide was written: Prometheus 3's native histograms cut series counts before you change any architecture.
Scaling Prometheus is where most teams first meet the limits of a single monitoring server; this guide walks the full path from one node to enterprise-grade observability. Prometheus is an open-source monitoring solution that provides a streamlined way to store metrics data, query metrics using PromQL, and set up alerting. It has become the de-facto standard for monitoring infrastructure and applications.
- Easy to setup: Prometheus is straightforward to deploy - simply run a single
prometheusbinary and you're ready to ingest and query metrics. It uses a single-node setup rather than a clustered architecture, making it simple to deploy but introducing scalability limitations that we'll discuss later. - Service Discovery and Pull-based model: The Prometheus server pulls metrics from your services through service discovery. This simplifies deployment since services don't need to know about the central Prometheus setup. Each application service only needs to expose its metrics over an HTTP server in the Prometheus text exposition format, and Prometheus will periodically pull these metrics based on the configured
scrape_interval. - Storage Engine: Prometheus stores time series data in memory and on local disk in an efficient custom format.
- Powerful Queries: Prometheus allows querying time series data via PromQL, a language that allows slicing and dicing of time series data over the labels and time ranges.
- Alerting: Prometheus supports alerting on the time series data with alert rules specified in PromQL, and notifications handled by Alertmanager.
- Third-party Integrations: Prometheus can easily collect data from third-party tools via exporters and also serve as a data-source for dashboarding tools such as Grafana.
Prometheus is a great starting point if you are just getting started with Observability. However, the reasons which make it easy to set up and operate at low scale are also the reasons why it can become challenging to operate Prometheus at scale.
To understand the limitations of Prometheus, we need to build a good mental model of how it stores data and what affects its scalability.
Time Series and High Cardinality: What Drives Memory Usage
Prometheus fundamentally stores all data as time series: streams of timestamped values belonging to the same metric and the same set of labeled dimensions.
For example, a time series with the metric name api_http_requests_total and the labels method="POST" and handler="/messages" could be written like this:
api_http_requests_total{method="POST", handler="/messages"}
For each time series, Prometheus stores a (timestamp, value) for the associated metric and set of labels at each scrape_interval. By default, Prometheus stores all time series in memory for two hours and flushes them to local on-disk storage at the end of the two-hour-interval.
Understanding Prometheus's data model helps us see that its memory usage directly correlates with the number of active time series it scrapes. This leads us to the cardinality explosion problem.
In the above example, if method can contain four possible values - GET, PUT, POST, and DELETE, and handler can contain ten possible values, the total cardinality of api_http_requests_total becomes 40 (4*10). If you then add a status label with two possible values (success or failure), the total cardinality increases to 80 (4*10*2).
High cardinality metrics can easily occur when you have dynamic labels or when the cross-product of multiple label cardinalities becomes large. Since the number of time series is determined by unique label combinations across all metrics, label cardinality directly impacts the Prometheus server's memory usage.
This highlights a key limitation of Prometheus: The memory required by a Prometheus server directly correlates with both the number of time series it scrapes and their associated scrape intervals. As the number of time series grows, vertical scaling of the Prometheus server becomes necessary.
What’s new on native histograms: Prometheus 3 native histograms (stable since v3.8) store an entire histogram as a single series with exponential buckets, instead of one series per bucket label.
For histogram-heavy workloads this cuts active series counts, and therefore memory, substantially. Reducing cardinality this way is step zero of scaling Prometheus, before any architecture change.
Local Storage and Data Retention: Managing Data on Disk
As mentioned earlier, Prometheus stores data older than 2 hours (by default) to local on-disk storage. Prometheus will further run compaction on the data sitting on disk to merge them into larger blocks. The reliance on local on-disk storage impacts reliability and durability of Prometheus setup as noted in Prometheus's Storage documentation:
“Note that a limitation of local storage is that it is not clustered or replicated. Thus, it is not arbitrarily scalable or durable in the face of drive or node outages and should be managed like any other single node database.”
In addition to scalability limitation of on-disk storage, it also adds additional operational overhead:
- The local storage needs to be backed up with snapshots to be able to recover from disk failures/operational errors.
- It needs to be capacity planned periodically to account for increase in the number of time series/infrastructure growth.
Query Performance: Walking the Performance Tightrope
PromQL allows slicing and dicing of data across various time ranges and labels. It allows complex queries which may require scanning through a lot of data. Given the single-process architecture of Prometheus, heavy queries may require excessive CPU or memory, causing OOM on the prometheus server or making it slow for other queries.
Beyond Single-Node: Strategies for Scaling Prometheus
Having examined the key limitations of single-node Prometheus setups, let's explore various solutions for scaling Prometheus.
Divide and Conquer: Functional Sharding
To address Prometheus's limitations in handling large numbers of time series, one approach is to shard the time series data across multiple Prometheus servers. This can be achieved by dividing the data based on teams, clusters, service groups, or other logical boundaries. While this allows running multiple Prometheus servers with each handling its own subset of time series data, it introduces new challenges.
The main drawback is the loss of centralized query capability across all metrics. Users need to know which metrics are stored on which servers and query them accordingly. Additionally, this approach prevents joining data from different metrics at query time if they're stored on different servers.
Building Bridges: Federation and Global Views
Prometheus's Federation feature enables one Prometheus server to scrape selected time series from another. This partially addresses the central visibility challenge by allowing a central Prometheus server to pull aggregated metrics from functionally sharded servers, providing an aggregate global view.
For example, you might set up multiple per-datacenter/region Prometheus servers that collect detailed data (instance-level drill-down), alongside global Prometheus servers that collect and store only aggregated data (job-level drill-down) from those local servers. This architecture provides both aggregate global views and detailed local views.
However, this approach still doesn't enable querying across all raw data.
Breaking Free: Remote Storage Solutions
Since neither Functional Sharding nor Federation fully solves central visibility or addresses data durability concerns, let's explore solutions that leverage remote storage.
Thanos: Global Querying with Object Storage
Thanos is an open-source project that extends Prometheus with long-term storage capabilities. Built on top of Prometheus, Thanos enables object storage as a long-term storage solution for Prometheus data. It offers three key benefits:
- A global query view across all Prometheus servers
- Durable long-term storage through object storage
- Deduplication of data from replicated Prometheus servers
Thanos maintains the same data format on object storage as Prometheus uses for its on-disk storage. By enabling unlimited storage, Thanos allows for unlimited data retention.
While it solves the central visibility problem by allowing unified querying across multiple Prometheus servers and object storage, Thanos still depends on individual Prometheus servers for data collection and recent data serving. This means you'll still need to handle capacity planning and functional sharding of Prometheus servers, along with their associated operational overhead.
Thanos includes a query frontend that can cache results and split long time range queries into smaller ones. While this improves query performance against object storage, heavy queries (especially those spanning long time ranges) may still experience slower performance.
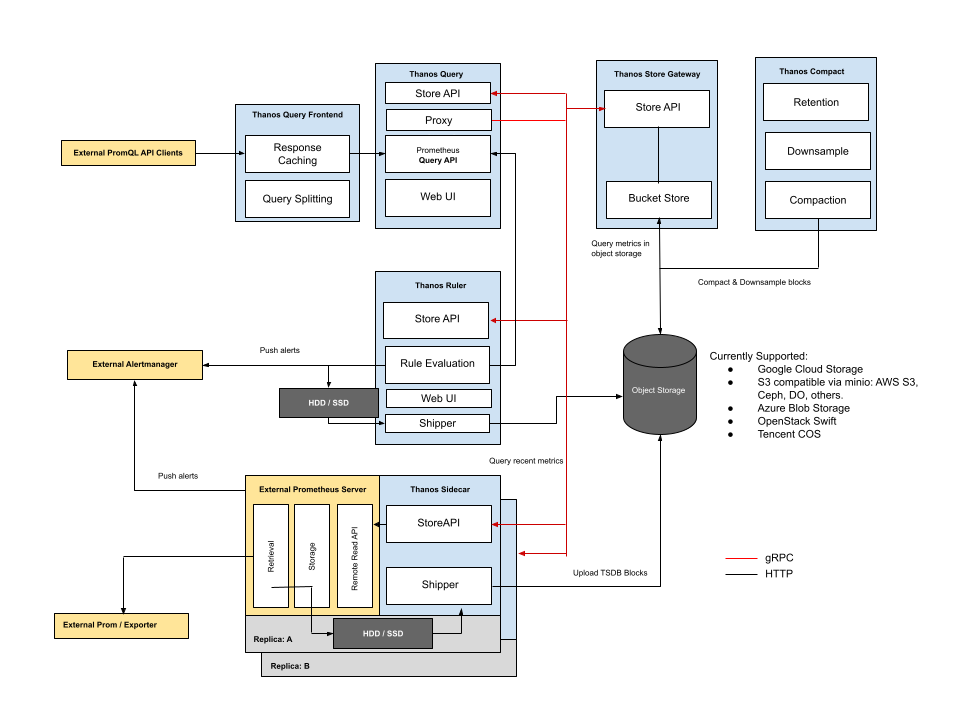
Source: https://thanos.io/tip/thanos/quick-tutorial.md/
Cortex: Multi-tenant Scalability
Cortex provides a horizontally scalable, multi-tenant, long-term storage solution for Prometheus. It accepts metrics data via the Prometheus remote-write protocol and stores them in object storage (similar to Thanos).
Unlike Thanos, Cortex eliminates the need for Prometheus servers to serve recent data since all data is ingested directly into Cortex. It also adds multi-tenancy features and allows for configuring various quotas and limits per tenant. However, like Thanos, query performance for long-range queries may be slower due to the need to fetch data from object storage.
Where Cortex stands in 2026: Cortex’s original maintainers moved to Grafana Mimir in 2022, and most new development in this architecture now happens in Mimir. Cortex itself is still maintained: it remains a CNCF incubating project and shipped v1.21 in 2026.
Amazon Managed Service for Prometheus is powered by Cortex, per AWS’s own FAQ, so the architecture also runs at cloud-provider scale inside AWS. For a new self-hosted deployment the community’s default is Mimir, and Grafana publishes a migration guide with a configuration converter for moving off Cortex.
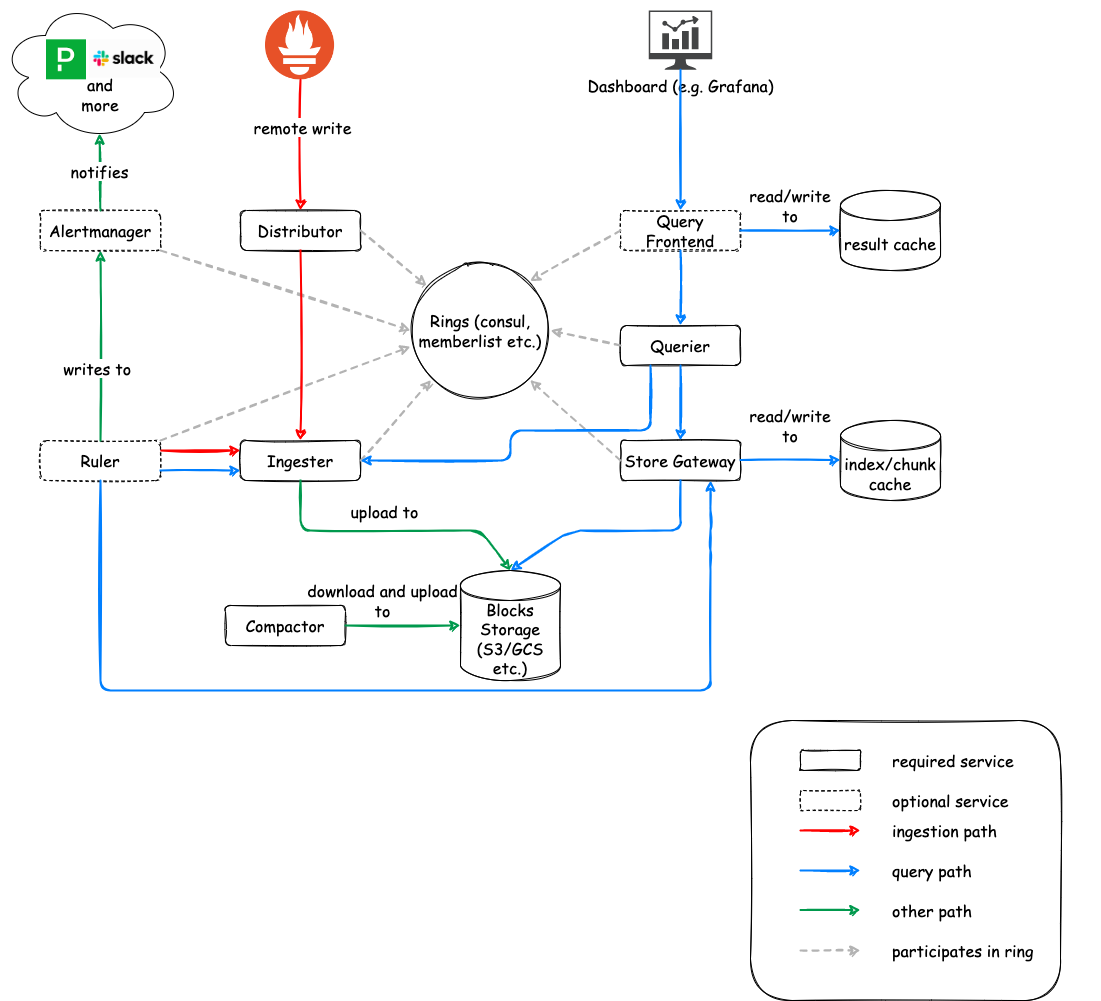
Source: https://cortexmetrics.io/docs/architecture/
Grafana Mimir: Enterprise-Ready Cortex Evolution
Grafana Mimir has a similar architecture as that of Cortex and was started out as a fork of Cortex due to licensing issues. Grafana uses Mimir architecture in their Grafana Cloud offering.
Since the fork, Mimir has become the actively developed branch of this architecture and the default choice for new centralized, multi-tenant metrics platforms. It keeps the Cortex model (horizontally scalable ingest over remote write, per-tenant limits, object storage for durability) and adds a split query engine that speeds up long-range queries.
Two caveats: it is a complex, many-component system to operate, and as a Grafana Labs project (AGPLv3), its roadmap follows Grafana Cloud's priorities.
Victoria Metrics: High Performance at Scale
Victoria Metrics offers a high-performance, open-source time series database and monitoring solution that can serve as Prometheus remote storage. It differs from Thanos and Cortex in two key ways:
- It uses disk storage rather than object storage
- It employs its own optimized columnar file format instead of the Prometheus format
Compared to Cortex, Victoria Metrics offers simpler setup and operation due to its streamlined architecture.
Making the Right Choice: Solution Comparison
We've explored how Prometheus excels as an easy-to-deploy metrics monitoring system at small scale, while examining its limitations at larger scales. We've also reviewed several open-source alternatives that address these limitations. Here's a summary of the solutions discussed:
| Dimension | Prometheus Federation |
Thanos | Cortex | Mimir | Victoria Metrics |
|---|---|---|---|---|---|
| Functional Sharding | ✅ | ✅ | Not Needed | Not Needed | Not Needed |
| Global Query View | 🟠 | ✅ | ✅ | ✅ | ✅ |
| Data Durability | 🔴 | 🟠 | ✅ | ✅ | 🟠 |
| Query performance | 🟠 | 🟠 | 🟠 | 🟠 | ✅ |
| Unlimited storage | 🔴 | ✅ | ✅ | ✅ | 🔴 |
| Operational Overhead | 🟠 | 🟠 | 🟠 | 🟠 | 🟠 |
| High Cardinality | 🔴 | 🔴 | ✅ | ✅ | ✅ |
| Actively developed (2026) | ✅ | ✅ | 🟠 Maintained; new work in Mimir | ✅ | ✅ |
| Multi-tenancy / per-team limits | 🔴 | 🟠 Basic | ✅ | ✅ | 🟠 Cluster version |
| Managed offering | ✅ AWS, Google Cloud, Azure | ✅ Exoscale (Managed Thanos) | ✅ AWS (Amazon Managed Prometheus) | ✅ Grafana Cloud | ✅ VictoriaMetrics Cloud |
Key: ✅ handled well · 🟠 partial or with caveats · 🔴 not addressed.
On managed Prometheus: if you want Prometheus without operating it, Amazon Managed Service for Prometheus, Google Cloud Managed Service for Prometheus, Azure Monitor managed service for Prometheus, Grafana Cloud and Oodle all offer it. None of them run stock Prometheus underneath: Amazon’s is powered by Cortex, Google’s is built on Monarch (the datastore behind Google’s own monitoring), Grafana Cloud runs Mimir, and Oodle runs its own object-storage engine. All speak PromQL and remote_write, so the choice is about operations, retention and cost rather than query language.
Which should you choose?
- You have a working Prometheus fleet and mainly need retention and one query view: pick Thanos. It is the least disruptive option and extends what you run today.
- You are building a centralized, multi-team metrics platform from scratch: pick Mimir, or a managed equivalent. Not Cortex in 2026.
- You want the least operational burden and fast queries, with retention bounded by disk: pick VictoriaMetrics.
- You just hit your first memory wall: before adopting any of these, reduce cardinality by dropping unused labels and adopting native histograms. The cheapest scaling is fewer series.
What Prometheus 3 changes for scaling
This guide was originally written for Prometheus 2.x. The 3.x line (v3.13 as of this update) changes the scaling picture in three ways:
- Native histograms (stable in v3.8): exponential-bucket histograms stored as one series instead of a dozen bucket series. The single biggest lever against cardinality-driven memory growth.
- Native OTLP ingestion: Prometheus can receive OpenTelemetry metrics directly at
/api/v1/otlp/v1/metricsonce the--web.enable-otlp-receiverflag is on, no collector required, which simplifies mixed OTel/Prometheus estates. - Remote Write 2.0: a leaner wire format (string interning, native histogram support) that cuts bandwidth and CPU when shipping metrics to backends like Mimir or VictoriaMetrics.
Frequently asked questions
How do you scale Prometheus?
In three stages: first reduce what you ingest (drop unused labels, use native histograms), then split load across servers with functional sharding and add federation for an aggregate global view, and finally move long-term storage to a horizontally scalable backend such as Thanos, Grafana Mimir, or VictoriaMetrics when you need durability and a single query view over raw data.
That is the standard path to running Prometheus at scale.
What is Prometheus sharding?
Running multiple Prometheus servers that each scrape a subset of your targets, split by team, cluster, or service. Each server holds fewer time series, keeping memory manageable.
The cost is that no single server can answer queries across all of your metrics.
How many time series can a single Prometheus server handle?
There is no hard limit; memory is the constraint. Well-provisioned single servers commonly run low single-digit millions of active series.
Budget roughly a few kilobytes of RAM per active series, more with high churn, and watch query load, which competes for the same memory.
What are the four types of metrics in Prometheus?
Counter (a value that only goes up, like requests served), gauge (a value that goes up and down, like memory in use), histogram (observations bucketed by size, like request latency), and summary (like a histogram, with quantiles computed client-side).
Prometheus 3 adds native histograms, a more efficient histogram representation.
Is Cortex still maintained in 2026?
Yes. Cortex remains a CNCF incubating project with regular releases (v1.21 shipped in 2026), and Amazon Managed Service for Prometheus is built on it. Its original maintainers moved to Grafana Mimir in 2022 and most new development happens there, which is why new self-hosted deployments usually pick Mimir.
Does Prometheus scale horizontally?
Not by default. Prometheus is a single-node system with no built-in clustering, so one server scales only vertically (more memory and CPU).
Horizontal scale comes from the patterns in this guide: functional sharding across servers, federation for an aggregate view, or remote-writing into a horizontally scalable backend such as Thanos, Mimir, or VictoriaMetrics.
What are the limitations of Prometheus federation?
Federation scrapes selected, usually pre-aggregated series from other Prometheus servers, so you still cannot query all raw data in one place.
The federating server adds its own scrape delay, becomes another component to size and operate, and its load grows with every series it pulls. It also does nothing for long-term durability, which is why remote-storage backends exist.
Which monitoring tools extend Prometheus for enterprises?
The main open-source options are Thanos, Grafana Mimir, and VictoriaMetrics, which add durable storage, a global query view, and multi-tenancy on top of Prometheus.
Managed options include Amazon Managed Service for Prometheus, Grafana Cloud, and fully Prometheus-compatible platforms such as Oodle.
Related reading on the Oodle blog
- How these scaling trade-offs shaped Oodle's own architecture: Building a high-performance, low-cost metrics observability system
- The query-performance side of the same problem: How Oodle keeps observability fast at scale
- Finding the bottlenecks before you scale the monitoring around them: Go profiling in production
In the next part of this blog series, we will look at how Oodle solves the scalability issues of Prometheus in detail. Stay tuned!
In the meantime: every option above trades one kind of operational work for another. Oodle's serverless metrics engine takes a different approach: an object-storage-native backend that is fully Prometheus-compatible (PromQL in, PromQL out), with no clusters to size and without the usual retention and cardinality trade-offs.