
Go faster! Golang performance optimization in production
Optimizing Golang for performance and scale


TL;DR;
You can definitely use Golang for performance-sensitive applications, especially if you are careful with memory allocation.
At Oodle, we used Golang to build a high-performance metrics observability platform, and our journey was filled with learnings along the way. Try out our playground with 100M+ active time series/hr & 34B+ samples/day.
In this guide: the eight techniques that did the most for our data path, in the order we reach for them:
- Reuse HTTP buffers (FastHTTP) · reuse protobufs on gRPC (VTProto)
- Reuse slices & maps · type-safe pools (safepool)
- Tune the GC with GOGC & GOMEMLIMIT
- Pass values instead of pointers (when benchmarks agree)
- Profile first · benchmark before deciding · PGO builds
Plus: why Go services burn CPU, which fix to try first, and an FAQ.
Why did we choose Golang?
We chose Golang to build Oodle, a high-scale observability system, from the ground up. Given that established observability tools like Prometheus, VictoriaMetrics, and Grafana Mimir are built on Golang, we knew it was a viable option.
What also made Golang appealing is its simplicity and ease of learning. It’s a language that allows developers to quickly get up to speed, which is a huge plus when you’re building and scaling systems rapidly. However, there were still several lessons we learned as we optimized performance throughout the journey.
Key Learning
One of Golang’s characteristics is that it has garbage collection (GC). This means high memory allocation can trigger GC pauses, increase CPU usage, and in extreme cases, lead to out-of-memory (OOM) crashes. To mitigate these risks, much of our optimization focused on reducing memory allocations, particularly in the application’s data path, which is critical for high-throughput systems.
Why is my Go application using high CPU?
In our experience, unexpectedly high CPU in a Go service usually has one of two causes: the garbage collector running hot because the code allocates too much, or the runtime fighting its container's CPU limit. Both show up clearly in a profile.
- GC churn from allocations. Every byte allocated is work the collector must do later. If a CPU profile shows
runtime.gcBgMarkWorkerand allocation functions near the top, the GC is your CPU bill, and the memory techniques below attack exactly this. - Container CPU throttling. Before Go 1.25,
GOMAXPROCSdefaulted to the host's core count even when the container was limited to a fraction of it, so the kernel throttled the process (long pauses, high tail latency). Go 1.25 made GOMAXPROCS container-aware; on older versions, set it to the container's CPU limit (e.g. withuber-go/automaxprocs). - Confirm before changing anything. A 30-second CPU profile (setup in the profiling section below) tells you which of the two you have.
For running this continuously against live services, see our guide to Go profiling in production.
Inter-service communication
In today’s world, microservice architectures are the norm, and with them comes the need for efficient inter-service communication. HTTP and gRPC are two popular protocols for this.
HTTP
Problem
Every HTTP request includes a body, and Golang’s default HTTP server allocates memory for that body on every request.
Solution
We switched to FastHTTP, a library that reuses buffers across requests, significantly cutting down memory allocations. While the syntax differs from the standard net/http package, the performance boost made it a worthwhile switch for our data-intensive application.
gRPC
Problem
gRPC allocates memory on both the client and server sides, which can lead to memory pressure when transmitting large protobufs frequently.
Solution
We leveraged VTProto, which allows us to reuse protobufs on the client side, avoiding unnecessary reallocations. Paired with gRPC streaming, VTProto made gRPC clients more memory efficient.
resp := responsepb.ResponseFromVTPool()
// Return the object to the pool when the function returns.
defer resp.ReturnToVTPool()

client, err := grpcClient.FindStreaming(ctx, req)
if err != nil {
    return err
}

if err = client.RecvMsg(resp); err != nil {
    return "", err
}
On the server side, while gRPC still allocates new memory for each transmission, an upcoming optimization in the gRPC core should address this. We intend to make use of this optimization as soon as it makes into a stable version.
Update: this shipped. The optimization above landed in grpc-go v1.66.0 (August 2024): a new codec built on the mem package's BufferSlice recycles buffers instead of allocating per message. On a current grpc-go you get server-side buffer reuse out of the box, so it is worth re-running your allocation benchmarks after upgrading.
Memory allocation
Pool
Frequent memory allocations can be costly. For example, consider this code:
for i := 0; i < 10000; i++ {
   x := make([]int64, 128*1<<10)
   doSomething(x)
}
This would allocate about 9.8 GiB (128 KiB * 8 (int64) * 10000) of memory! By refactoring it to reuse the slice, we drastically reduce memory usage at the cost of a bit more CPU:
x := make([]int64, 128*1<<10)
for i := 0; i < 10000; i++ {
   for j := 0; j < 128*1<<10; j++ {
      x[j] = 0
   }

   doSomething(x)
}
In this case, memory usage dropped to just 1 MB. By reusing slices, maps, and other objects, we significantly reduced memory pressure in our application. Above is a simple example to demonstrate the core technique for reusing slices/maps etc. - get an object from existing allocated objects and reset before use. Golang’s sync.Pool also helps with object reuse, but it’s not type-safe, which can introduce bugs if not handled carefully.
When using pools, it is a good practice to get an object from a pool and return it back to the pool in defer.
bufPool := sync.Pool{
   New: func() interface{} {
      return new(bytes.Buffer)
   },
}

...

buf := bufPool.Get().(*bytes.Buffer)
buf.Reset()
defer bufPool.Put(buf) // Defer return to the pool
With this approach
- You don’t miss returning an object back to the pool
- You don’t return the same object to the pool twice - this can cause hard-to-debug data corruptions.
SafePool
To solve the safety issues with sync.Pool, we developed and open-sourced safepool, a type-safe version of sync.Pool. It makes pool usage clearer and reduces the likelihood of errors.
Pool Manager
Sometimes, the lifecycle of an object extends beyond the function where it was created. In such cases, we use PoolManager (part of safepool) to manage objects across functions, ensuring that everything is returned to the pool properly without leaks or corruption.
Note in the example there is no error handling for brevity.
type DirInfo struct {
   fileNameToData map[string][]byte
}

func getDataForPath(path string) []byte {
   file, _ := os.Open(path)
   data, _ := io.ReadAll(file)
   return data
}

func getDataForFilesInDir(dir string) *DirInfo {
   paths, _ := os.ReadDir(dir)

   dirInfo := &DirInfo{
      fileNameToData: make(map[string][]byte),
   }
   for _, path := range paths {
      dirInfo.fileNameToData[path.Name()] = getDataForPath(filepath.Join(dir, path.Name()))
   }

   return dirInfo
}

func main() {
   dataForTimeRange := getDataForFilesInDir("/tmp/foo")
   // Do something with dataForTimeRange
}
In this example, getDataForPath does memory allocations and this allocation lives beyond the live cycle of that function.
To solve use cases like this, the concept of a PoolManager was added in the safepool package. With the pool manager the above code becomes.
type DirInfo struct {
   fileNameToData map[string][]byte
}

func getDataForPath(path string, bufPoolManager *safepool.PoolManager[bytes.Buffer]) []byte {
   file, _ := os.Open(path)
   buf := bufPoolManager.Get()
   _, _ = io.Copy(buf, file) // Minimizes allocations
   return buf.Bytes()
}

func getDataForFilesInDir(dir string, bufPoolManager *safepool.PoolManager[bytes.Buffer]) *DirInfo {
   paths, _ := os.ReadDir(dir)

   dirInfo := &DirInfo{
      fileNameToData: make(map[string][]byte),
   }
   for _, path := range paths {
      dirInfo.fileNameToData[path.Name()] = getDataForPath(filepath.Join(dir, path.Name()), bufPoolManager)
   }

   return dirInfo
}

func main() {
   anyListPool := safepool.NewPool[safepool.ListVal[any]]()
   bufPool := safepool.NewPool[bytes.Buffer]()
   bufPoolManager := safepool.NewPoolManager[bytes.Buffer](anyListPool, bufPool)
   defer bufPoolManager.ReturnToPool()
   dataForTimeRange := getDataForFilesInDir("/tmp/foo", bufPoolManager)
   // Do something with dataForTimeRange
}
In the above example, getDataForPath gets a buffer from a pool manager, and the buffer is returned to the pool when the bufPoolManager.ReturnToPool() executes.
Optimizing GC with GOGC and GOMEMLIMIT
High memory allocations can lead to out-of-memory crashes. By setting GOGC to a lower value than its default (100), you can make the garbage collector more aggressive, but this often results in higher CPU usage.
In recent versions of Go, it’s better to set GOMEMLIMIT, which makes the GC aggressive only when memory use approaches a service’s limit. This balance prevents crashes while reducing CPU overhead from unnecessary garbage collection.
This library is an easy way to automatically set GOMEMLIMIT in your services.
Where Go's GC stands in 2026: GOGC and GOMEMLIMIT work exactly as described here. What changed is the collector itself: Go 1.25 shipped an experimental redesign called "Green Tea", which marks memory page-by-page instead of object-by-object, and Go 1.26 made it the default, with the Go team measuring around 10% less GC time on many workloads, and up to 40% on some. Allocation-heavy services benefit most; the cheapest allocation is still the one you never make.
Pointers vs. Values
Allocating structs on the heap frequently can put a lot of pressure on the garbage collector. In some cases, passing structs by value, rather than as pointers, can be more efficient. It depends on the specific use case, so it’s important to benchmark before committing to an approach.
For instance, allocating an array of pointers:
type Foo struct {
   A int
}

var fooList []*Foo
for i := 0; i < 1000000; i++ {
   fooList = append(fooList, &Foo{A: i})
}
allocates 33 MB on the heap. But, by passing the struct by value instead:
type Foo struct {
   A int
}

var fooList []Foo
for i := 0; i < 1000000; i++ {
   fooList = append(fooList, Foo{A: i})
}
we can reduce this to just 23 KB, drastically lowering the number of allocations and improving performance.
Profiling for Performance Bottlenecks
Go has excellent profiling tools for both memory and CPU. By generating flame graphs and analyzing memory and CPU usage, we were able to identify bottlenecks and make informed decisions about where optimizations were needed.
For instance, using the pprof tool, you can gather memory and CPU profiles and view them in a browser to identify which parts of your code are causing the most strain. For example, in memory profiles you can look at which part of the code does the most allocations.
Recommended read: Go Profiling in Production covers running pprof continuously against live services, with CPU, memory, and goroutine analysis, without hurting performance.
Steps to take profiles
Let’s say we have this program
package main

import (
   "net"
   "net/http"
   _ "net/http/pprof" // Import to enable profiling
   "time"
)

func makeLargeSlice() []byte {
   return make([]byte, 4096)
}

func makeSmallSlice() []byte {
   return make([]byte, 1024)
}

func main() {
   go func() {
      listener, err := net.Listen("tcp", "localhost:6065")
      if err != nil {
         panic(err)
      }

      if err = http.Serve(listener, nil); err != nil {
         panic(err)
      }
   }()

   go func() {
      for {
         buf1 := makeSmallSlice()
         for i := range buf1 {
            buf1[i] = 1
         }

         buf2 := makeLargeSlice()
         for i := range buf2 {
            buf2[i] = 2
         }

         time.Sleep(10 * time.Millisecond)
      }
   }()

   time.Sleep(time.Hour)
}
The HTTP server is running on port 6065.
We can get the memory profile by running
go tool pprof http://localhost:6065/debug/pprof/heap
The above command will print the path where the profile is dumped.The view the profile on a browser, run
go tool pprof -http=:8085 <path_to_profile>
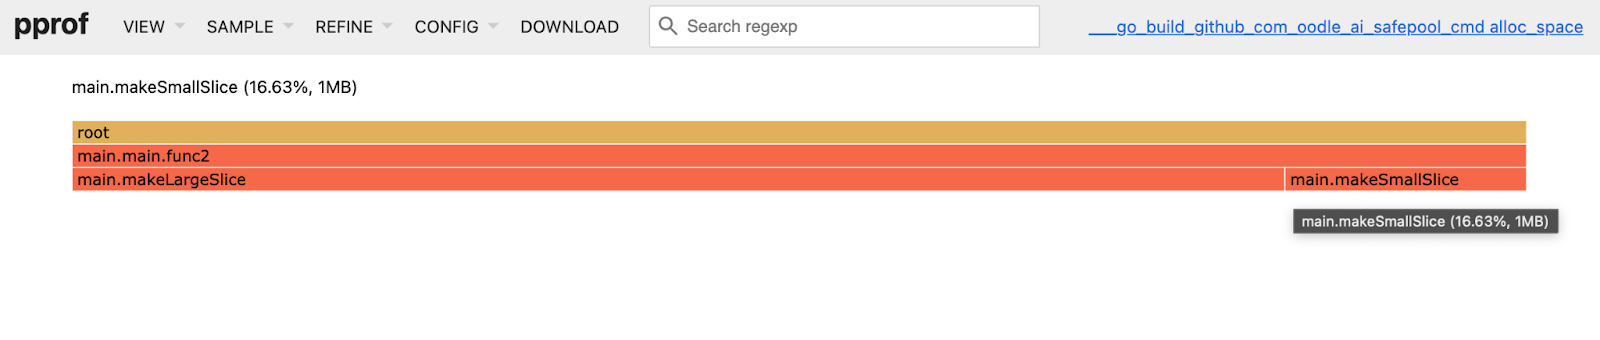
Similarly, a 30s CPU profile can be dumped by running
go tool pprof "http://localhost:6065/debug/pprof/profile?seconds=30"
Benchmarking
When in doubt, write benchmark tests to analyze your application's performance and allocation patterns. It’s crucial to get hard data before jumping to conclusions.
Profile-guided optimization (PGO): profiles that speed up the compiler
Profile-guided optimization (PGO) lets the Go compiler use a production CPU profile to optimize the code paths your service actually runs, with more aggressive inlining and devirtualization where the profile shows heat. It has been generally available since Go 1.21: save a pprof CPU profile as default.pgo next to main.go and go build picks it up automatically. The Go team reports 2–14% CPU improvements on representative benchmarks, for a one-line build change.
It composes with everything above: the same pprof profiles you collect to find bottlenecks become the input that speeds up the next build.
Which optimization should you reach for first?
Profile first, then fix the biggest allocator. This table summarizes every technique in this guide and when to use it:
| Technique | What it fixes | Cost / risk | Start here if… |
|---|---|---|---|
| Profile with pprof | Tells you which problem you have | ~None | Always: 30s CPU + heap profile first |
| Reuse slices & maps | Allocation churn in hot loops | Reset-before-reuse bugs | One function dominates the heap profile |
| Typed pools (sync.Pool / safepool) | Objects created per request | Use-after-return corruption | Request/response buffers |
| GOMEMLIMIT | OOM crashes; GC running hot | Very low | Any containerized service (Go 1.19+) |
| Values over pointers | Heap pressure from small structs | Copy cost: benchmark it | Large slices of small structs |
| FastHTTP | net/http per-request allocations | Different API from net/http | Very high-RPS plain-HTTP services |
| VTProto + gRPC streaming | Protobuf marshal/unmarshal churn | A codegen step | Chatty gRPC with large messages |
| PGO build | CPU in hot paths | Slightly slower builds | Service has a stable production profile |
If you only do three things:
- Take a CPU and heap profile. The top entry is usually a surprise.
- Fix the single biggest allocator with reuse or a pool.
- Set
GOMEMLIMITin every containerized service.
Risks of Optimizations
While memory optimization techniques like reusing buffers and using pools can significantly improve performance, they come with risks. Misusing these techniques can lead to subtle, hard-to-debug memory corruption issues.
Some common pitfalls include
- Using an object after it’s been returned to a pool
- Accidentally sharing the object with another thread
- Accidentally returning an object to a pool twice.
FAQs: Golang performance
Is Golang good for high-performance applications?
Yes. Go powers high-throughput systems like Prometheus, VictoriaMetrics, and Oodle's own metrics platform, which ingests 100M+ active time series an hour. The main cost to manage is garbage collection: keep allocations low in the hot path and Go competes well with lower-level languages for data-intensive services.
How do I reduce memory allocations in Go?
Reuse memory instead of re-allocating it: recycle slices and maps across iterations, pool objects that outlive one function (sync.Pool, or safepool for type safety), and prefer value semantics where benchmarks support it. In the slice example above, reusing one buffer cut allocations from ~9.8 GiB to 1 MB. Let a heap profile tell you which code path to fix first.
What is the difference between GOGC and GOMEMLIMIT?
GOGC controls how often the collector runs relative to heap growth, so lower means more frequent collection and more CPU. GOMEMLIMIT (Go 1.19+) sets a soft memory ceiling, making the GC aggressive only as the process approaches it. In containers, GOMEMLIMIT is usually the better first lever: it prevents out-of-memory crashes without a constant CPU tax.
Why does my Go HTTP server use so much memory?
Go's standard net/http server allocates memory for every request body, so a high request rate means a high allocation rate, GC pressure, and a growing heap. Buffer-reusing servers such as FastHTTP, plus pooling per-request objects, are the standard fixes, and that switch is what cut allocations in Oodle's data path.
Does Go's garbage collector make programs slow?
Only when allocation rates are high: the collector itself is fast, but frequent cycles steal CPU and can pause the program under memory pressure. Reducing allocations addresses the cause, GOMEMLIMIT tames the worst case, and Go 1.26's Green Tea collector cuts GC time further, by around 10% on many workloads and up to 40% on some.
Conclusion
While building Oodle, we found that Golang works really well for high-performance, data-intensive system. By profiling our system, reducing memory allocations, and carefully using pools, we were able to build a robust observability platform that handles massive scale. With the right tools and practices, you can achieve similar performance gains in your Golang applications!
Related reading
- Go Profiling in Production finds the bottlenecks this guide fixes: CPU, memory, and goroutine profiling on live services.
- Scaling Prometheus: From Single Node to Enterprise-Grade Observability, where these Go lessons came from.
- How Oodle Keeps Observability Fast at Scale, the system these optimizations power.