Speeding up Next.js Docker builds with OpenTelemetry Traces
We cut our Next.js build time by 25% using OpenTelemetry Traces. Here's how.

Over time, our Next.js app's build time crept up to 12 minutes - for a startup looking to ship features and close issues fast, this was unacceptably slow for us. GitHub Actions showed exactly one step: Build and push Docker image. When someone asked why it was slow, the answer was a shrug and "build time stuff."
We built an observability platform - we instrument production services down to individual database queries. We trace every API call, every log pipeline, every Kubernetes pod lifecycle. But our own CI pipeline? A 12-minute black box. The irony wasn't lost on us.
Well, we had built an observability product. So we used it - we pointed Oodle at itself.
Layer 1: CI Workflow Traces
We'd already added tracing instrumentation our GitHub Actions workflow with Thoth, which gave us spans for each workflow step.
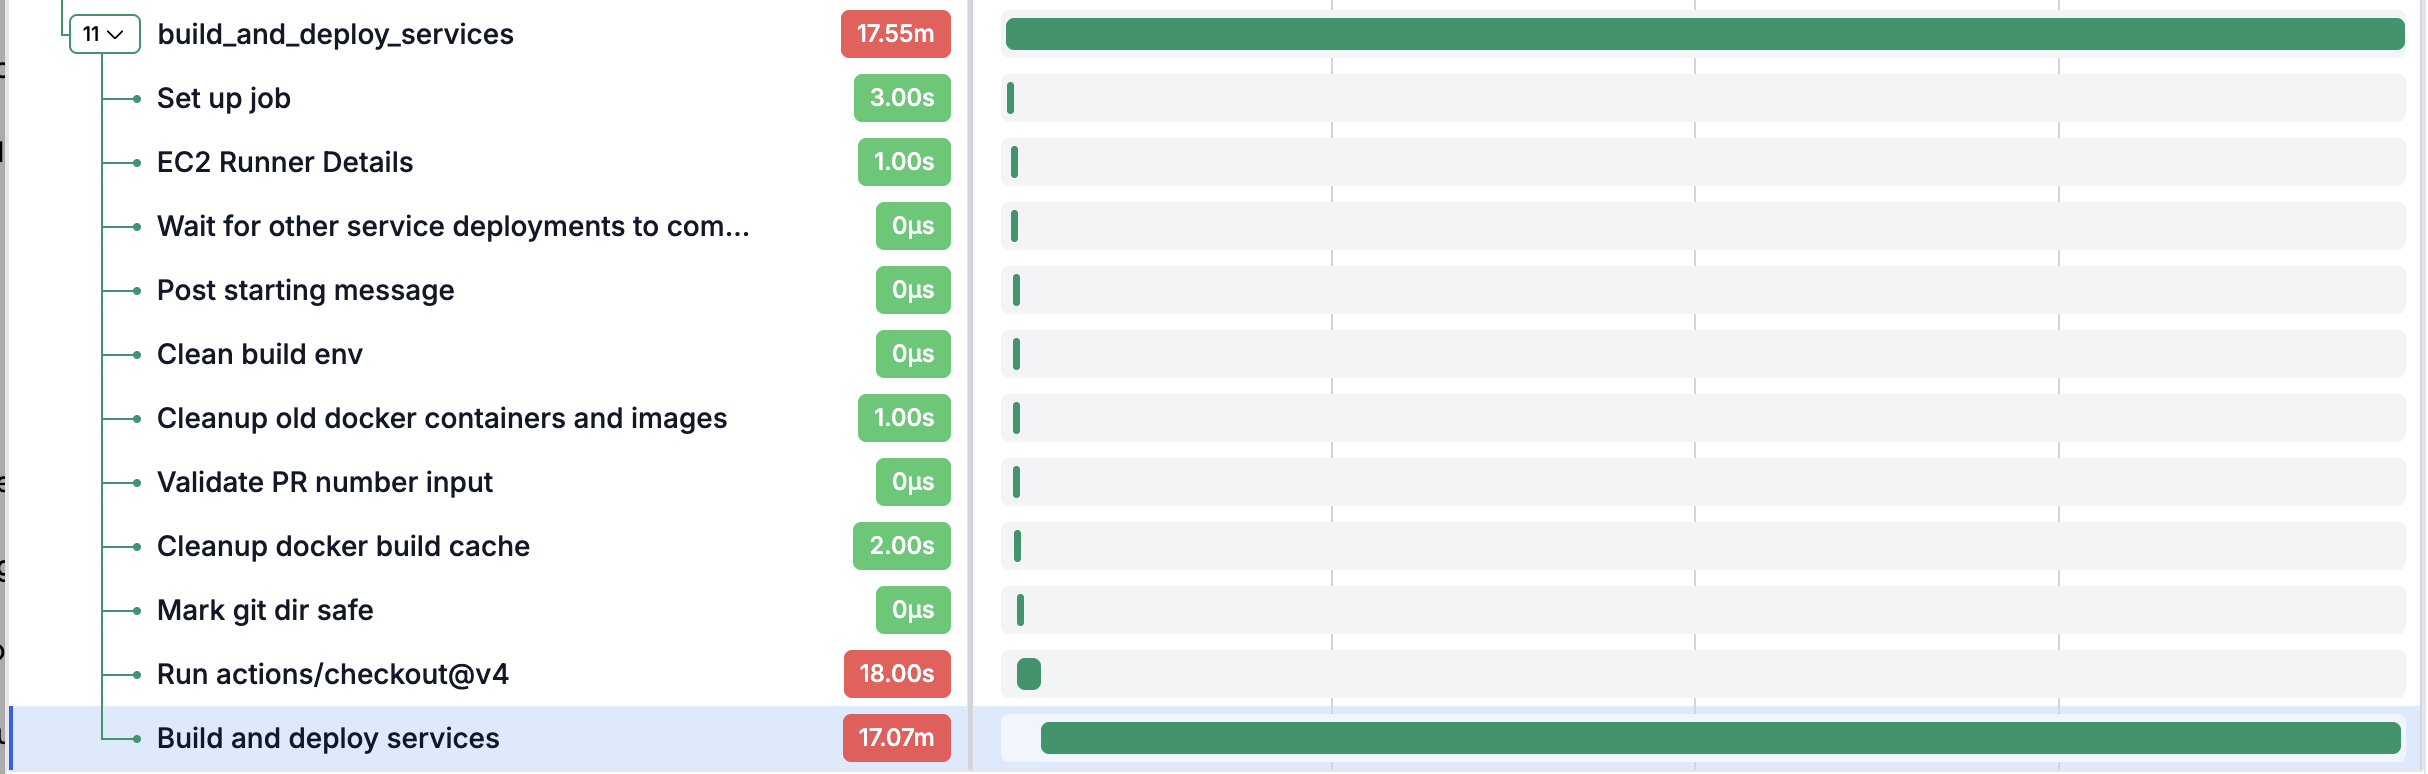
But the "Build and push Docker image" step was a single, opaque span - 12 minutes of something.
Was the time spent pulling base images? Installing npm packages? Running webpack? Pushing the final image to ECR? We had no way to tell without SSH-ing into the runner and adding time prefixes to Dockerfile commands like it was 2014.
Layer 2: BuildKit's Native OpenTelemetry support
Docker's BuildKit engine has built-in OpenTelemetry support. Most people don't know this because it's not enabled by default - you have to configure it via --driver-opt environment variables when creating a docker-container driver buildx builder.
Our internal build CLI tool already used docker buildx build with the container driver. We added a function that configures the builder with OTel driver opts pointing at our collector:
func otelDriverOpts() string {
apiKey := os.Getenv("OODLE_OTEL_API_KEY")
if apiKey == "" {
return ""
}
// buildx CSV-splits --driver-opt values, so
// headers with commas need inner double quotes
quotedHeaders := fmt.Sprintf(
"env.OTEL_EXPORTER_OTLP_HEADERS=%s",
headers,
)
return fmt.Sprintf(
" --driver-opt %q"+
" --driver-opt %q"+
" --driver-opt %s"+
" --driver-opt %q",
"env.OTEL_EXPORTER_OTLP_TRACES_ENDPOINT="+endpoint,
"env.OTEL_EXPORTER_OTLP_PROTOCOL=http/protobuf",
quotedHeaders,
"env.OTEL_SERVICE_NAME=docker-buildkit",
)
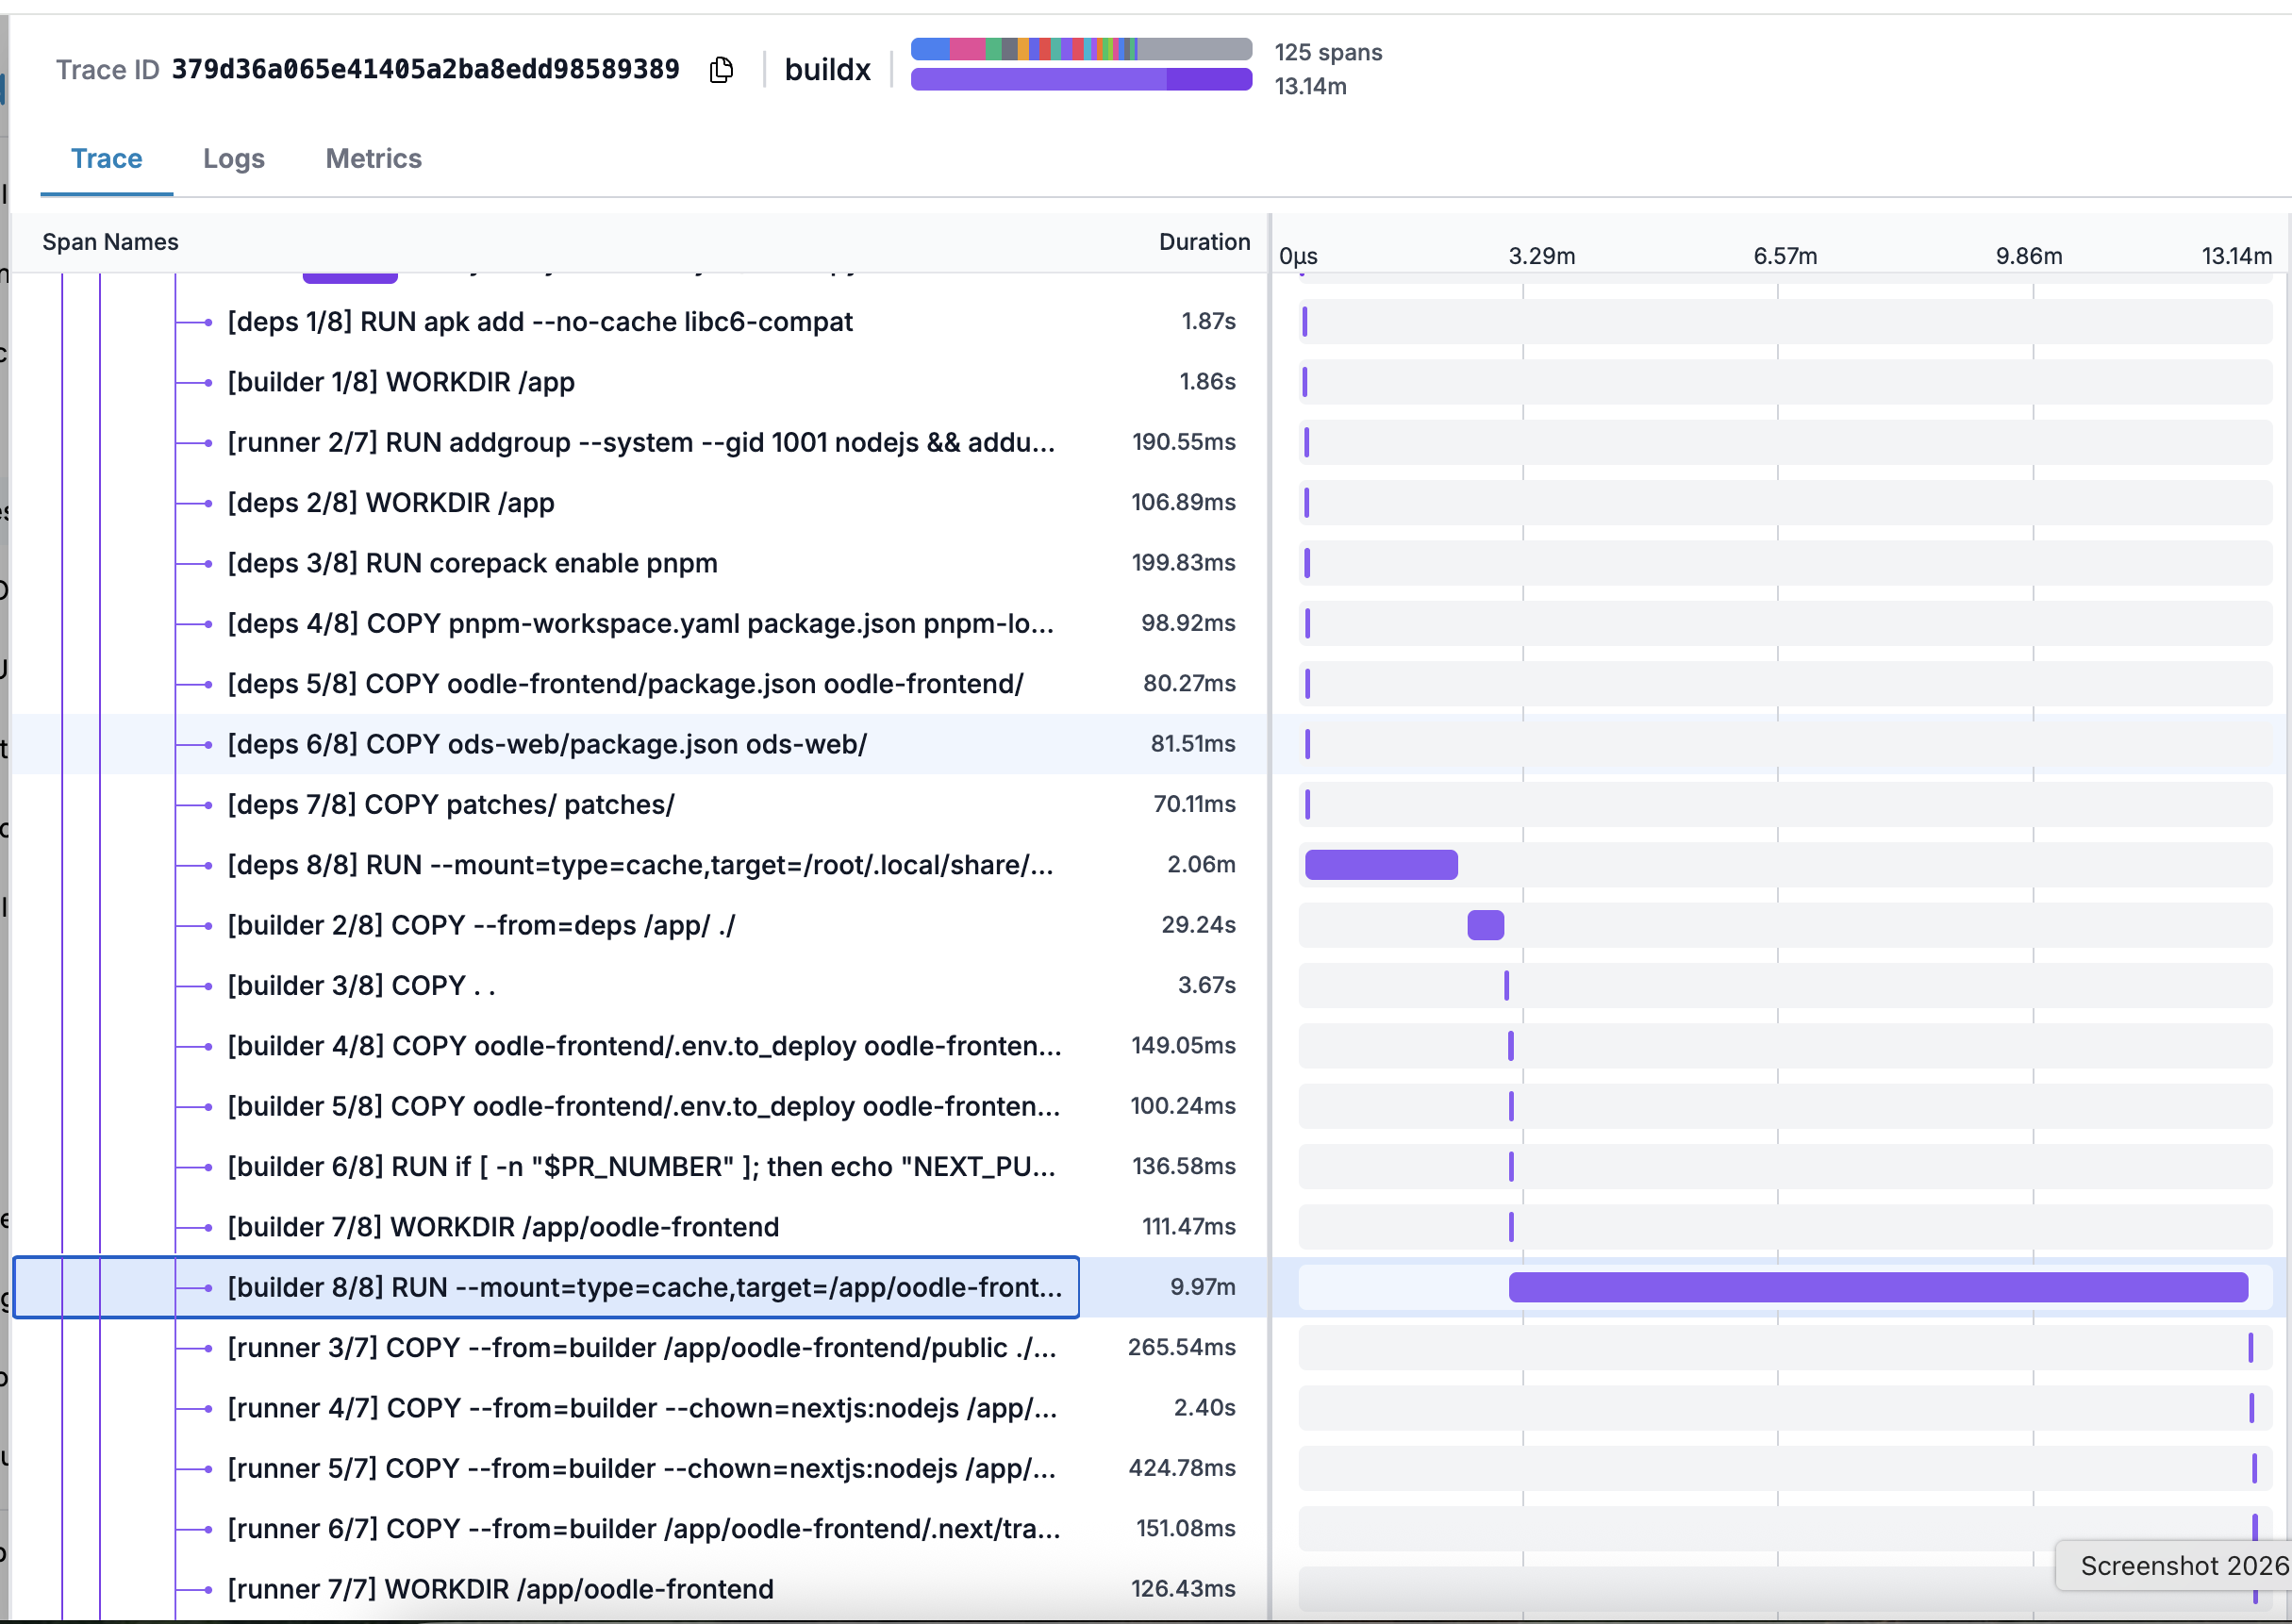
}This immediately gave us per-instruction spans for every RUN, COPY, and FROM in the Dockerfile. Cache hits, cache misses, layer build times - all visible.
Layer 3: Trace Context Propagation
With BuildKit tracing enabled, spans appeared in Oodle - but in a completely separate trace from the GitHub Actions job. BuildKit was happily exporting its spans, but it had no idea it was part of a larger CI workflow.
The problem: the Docker CLI sits between GitHub Actions and the BuildKit daemon, and it doesn't propagate W3C trace context by default. Without explicit TRACEPARENT propagation, BuildKit starts a new trace.
For our CI, our GitHub Actions instrumentation action (Thoth) already sets TRACEPARENT in the job environment. We just needed the Docker CLI to pick it up, which it does automatically when OTEL_EXPORTER_OTLP_TRACES_ENDPOINT is set on the host process:
func ensureTraceparent() {
    if os.Getenv("TRACEPARENT") != "" {
        return
    }
    traceID := make([]byte, 16)
    spanID := make([]byte, 8)
    _, _ = rand.Read(traceID)
    _, _ = rand.Read(spanID)
    tp := fmt.Sprintf(
        "00-%s-%s-01",
        hex.EncodeToString(traceID),
        hex.EncodeToString(spanID),
    )
    os.Setenv("TRACEPARENT", tp)
}
Now BuildKit spans landed as children of the "Build and push Docker image" step in the CI trace. One trace, from workflow trigger to image push.
Layer 4: Next.js Build Traces
BuildKit tracing showed us every Dockerfile instruction. But the longest instruction - RUN pnpm run build - was still a single 9-minute span. That's the Next.js production build: webpack compilation, route generation, static optimization. All of it collapsed into one line.
Next.js actually writes detailed build timing data to a .next/trace file during next build. Each webpack compilation pass, each optimization step, each route - they're all in there as newline-delimited JSON events with IDs, parent IDs, and durations. But this data stays inside the Docker container and gets thrown away when the build finishes.
We wrote a post-build script that reads .next/trace, reconstructs the span tree, wraps everything in a synthetic next-build root span, and exports the whole thing as OTLP spans.
One complication: we couldn't run this script inside the Docker build. BuildKit's docker-container driver sandboxes network access in RUN layers, so the export script couldn't reach the OTLP collector. We tried --network=host on the RUN directive, but the container driver doesn't support it.
The solution: extract .next/trace from the built image after the build completes, then run the export on the host where network access works fine:
func ExportBuildTraces(
    ctx context.Context,
    oodleRootDir string,
    imageRef string,
) {
    // ...
    // Create a throwaway container from the image
    createCmd := fmt.Sprintf(
        "docker create --name %s %s true",
        containerName, imageRef,
    )
    // Extract .next/trace to host
    cpCmd := fmt.Sprintf(
        "docker cp %s:%s %s",
        containerName,
        "/app/oodle-frontend/.next/trace",
        traceFile,
    )
    // Run export with trace context
    exportCmd := fmt.Sprintf(
        "TRACEPARENT=%s ... node %s %s",
        tp, scriptPath, traceFile,
    )
}
What the Trace Revealed
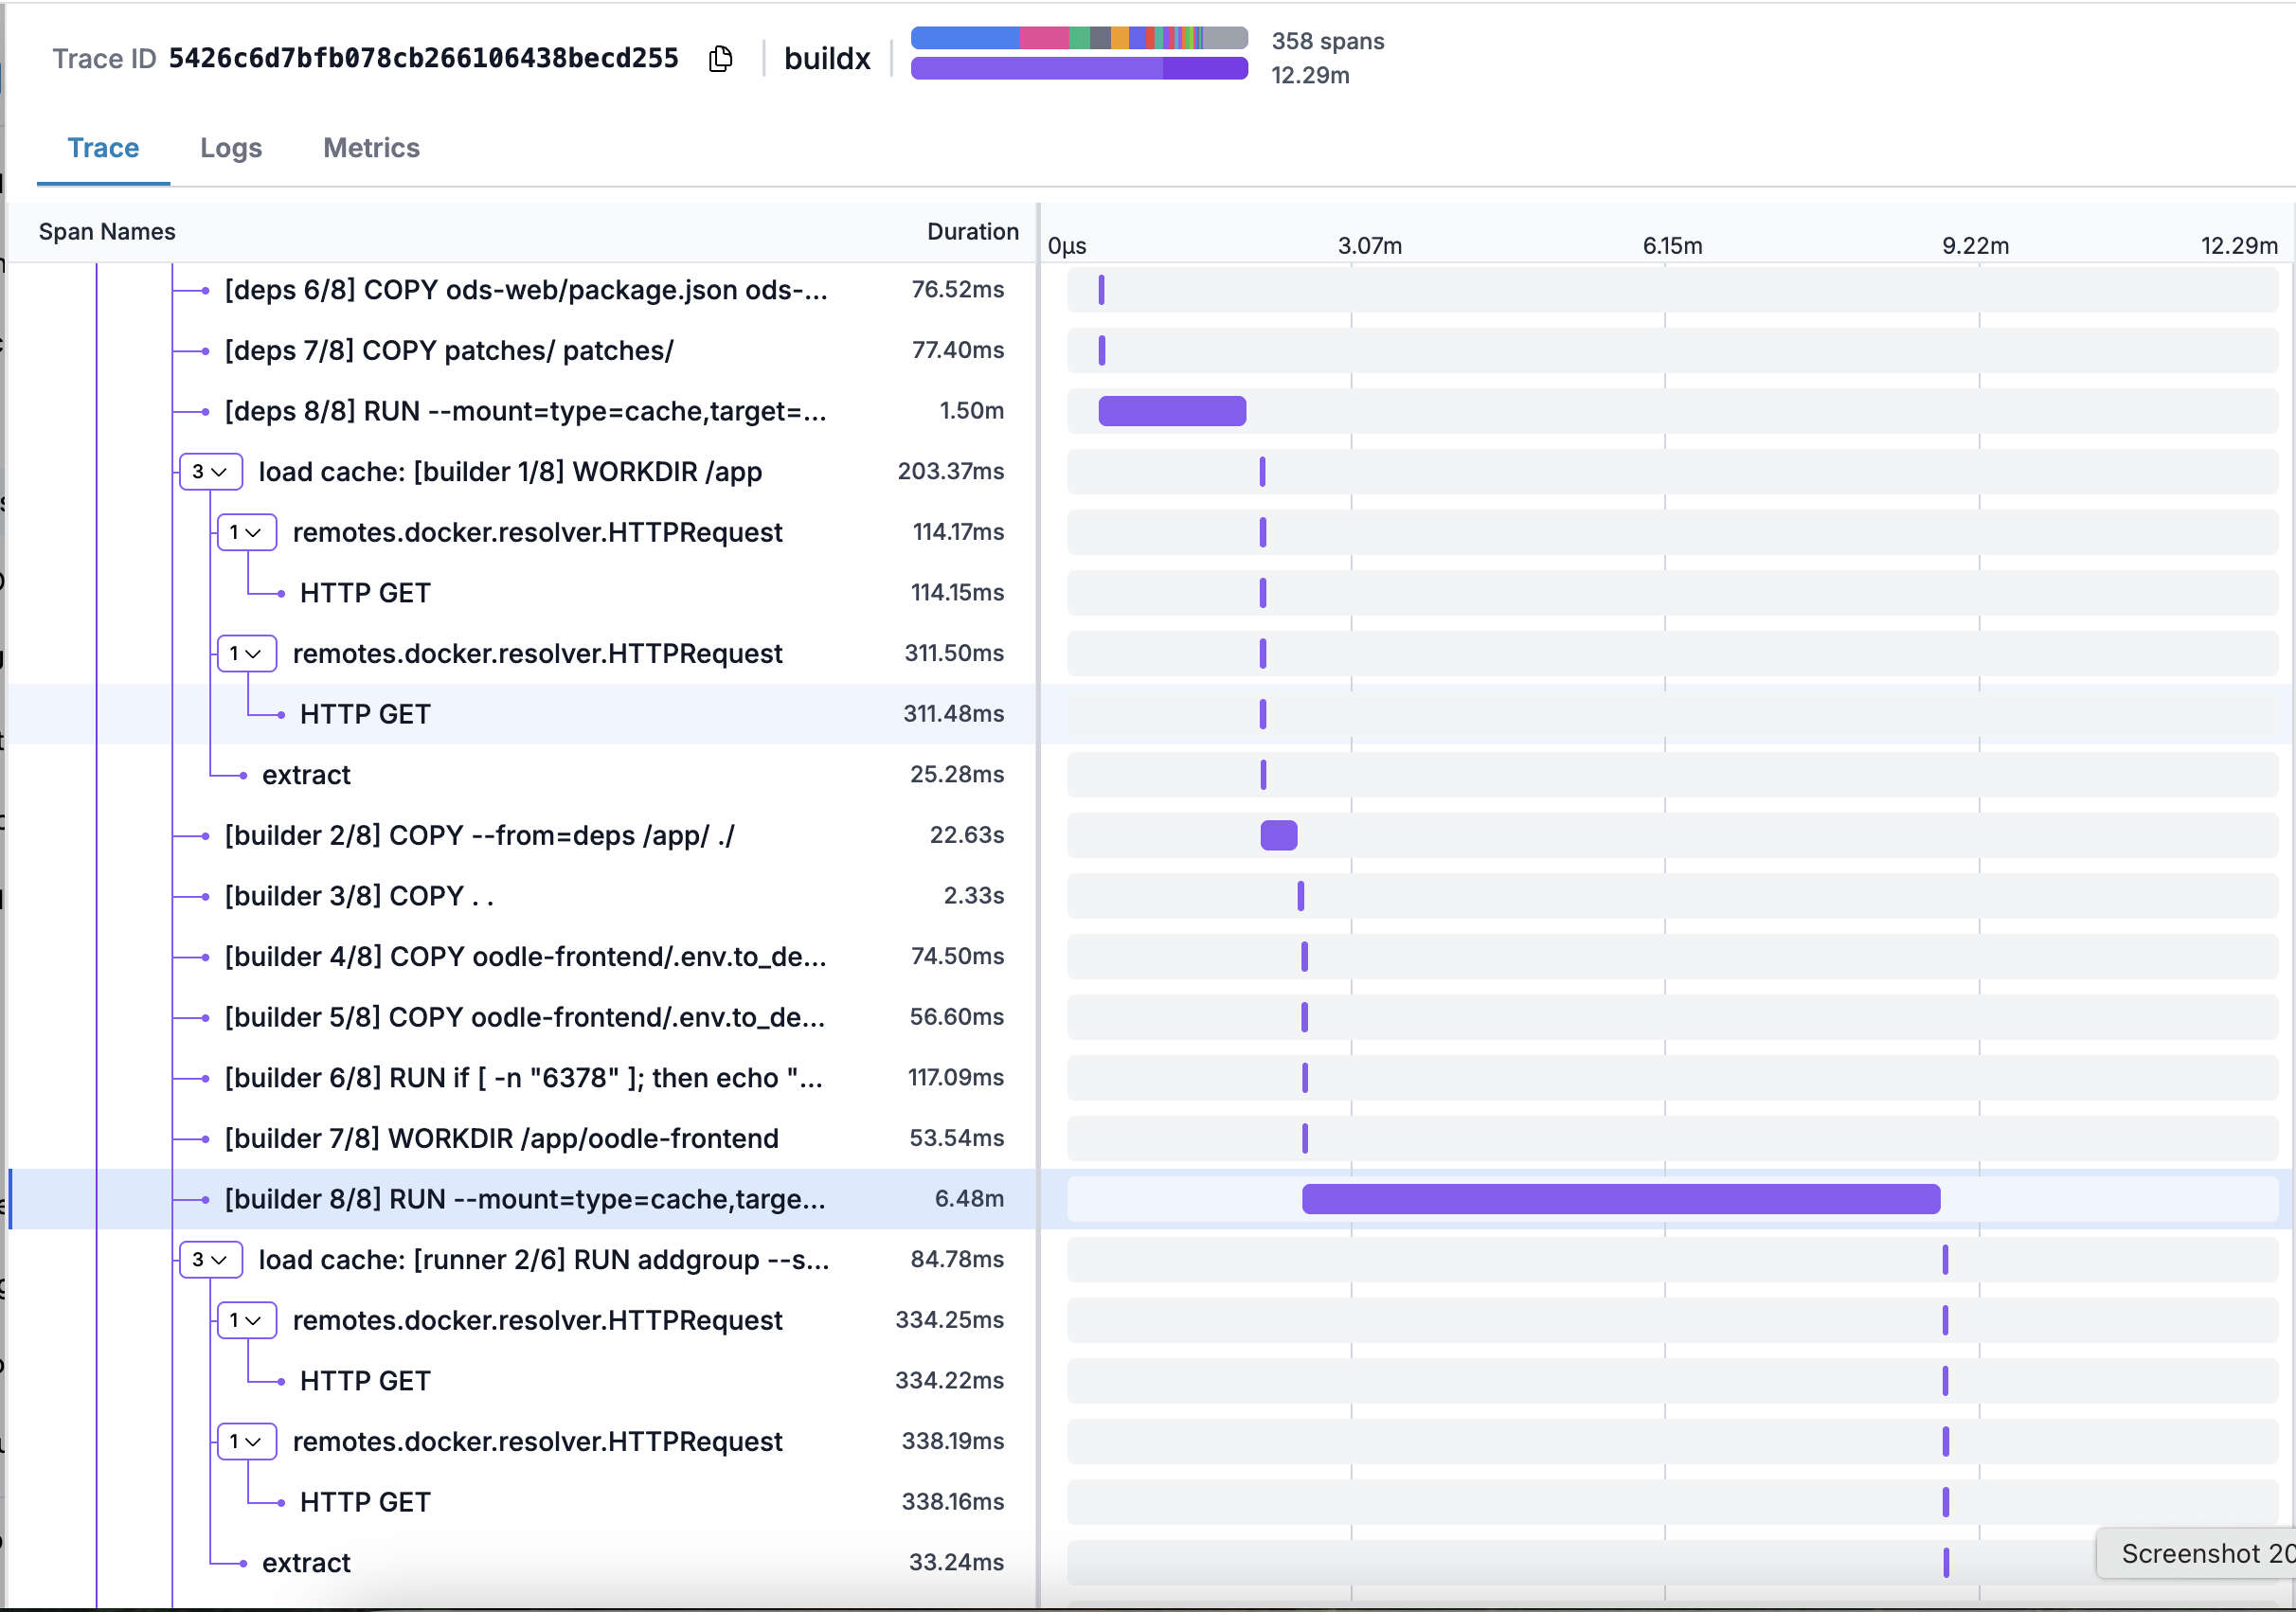
Once the tracing worked, we had a complete picture: one trace spanning from the GitHub Actions trigger through every BuildKit instruction, into every webpack compilation pass inside next build. Thousands of spans per build, all queryable in Oodle's traces UI.
Due to the high # of spans, I downloaded the trace into a file, then fed it into Cursor with Opus 4.6 and asked it to find the bottlenecks.
The diagnosis came back in seconds. The 9-minute next build step was spending roughly 80% of its wall time in webpack compilation. And within webpack, the bottlenecks were specific and fixable.
Each fix targeted a bottleneck that was directly visible in the traces.
- Remove
NEXT_PROFILE_BUILDenv variable. One line deleted from.env.dev. Profiling mode stays available as an opt-in; it just stops running on every build. optimizePackageImports: Next.js has a config option that rewrites barrel imports into direct submodule imports at build time. We added 24 packages:
optimizePackageImports: [
    'echarts', 'zrender',
    '@grafana/ui', '@grafana/data',
    '@codemirror/view', '@codemirror/state',
    '@codemirror/language', '@codemirror/autocomplete',
    'recharts', 'lucide-react',
    'react-icons', 'react-icons/io5',
    'react-icons/pi', 'react-icons/lia',
    'react-icons/hi',
    'lodash', 'date-fns',
    '@heroicons/react', '@headlessui/react',
    '@sentry/nextjs',
    '@opentelemetry/semantic-conventions',
    // ...
],
Instead of webpack resolving every export from @heroicons/react to find the three icons we actually use, Next.js rewrites the import to point directly at the submodule.
- webpackBuildWorker: true. This experimental Next.js flag moves webpack compilation to a worker thread, freeing the main Node.js process and enabling parallel compilation of server and client bundles on multi-core CI runners.
- Expand
.dockerignore. We excluded everything the frontend image doesn't need:
# Sibling apps not needed for oodle-frontend build
oodle-docs-site/
ui-performance-tests/

# Storybook
*/.storybook/
**/*.stories.tsx
**/*.stories.ts

# Tests
*/__checks__/
*/__tests__/
**/*.test.ts
**/*.test.tsx
**/*.spec.ts
**/*.spec.tsx- Refactor render functions into components.
renderIntegrationCardwas a render function that was flagged as a bottleneck in the build time - we refactored it into a properIntegrationCardcomponent.
Result: build time went from roughly 12 minutes to 9 minutes - verified by comparing before/after traces in Oodle.
The takeaway
The hard part was having proper build telemetry - instrumentation data to see where the build time was being spent. Once we had instrumentation via build traces, the fixes were obvious.
If your CI builds are black boxes, they don't have to be. OpenTelemetry support in BuildKit is already there - it just needs to be turned on.
If you're looking for an agent-native Observability platform for your team, sign up for Oodle.