
One Endpoint Change: CureFit's 3× Savings with Oodle

TL;DR
- CureFit migrated metrics in under 6 hours by changing one Prometheus
remote_writeendpoint. - They moved 156 dashboards without rebuilding and kept Prometheus/Grafana workflows intact.
- They report 3x lower metrics cost, faster dashboards, and are now expanding into APM and anomaly detection.
This Started With a Recommendation
CureFit runs one of India's largest health-tech platforms across fitness, nutrition, and wellness. Their observability setup was functional: Prometheus scrapers, remote write, Grafana-compatible dashboards, and local Alertmanager for vendor neutrality.
Kunal Khandelwal, Lead of Infrastructure and Security, did not start this evaluation because something exploded. A colleague recommended Oodle. That was enough to run a PoC and ask a practical question: if we can keep the same Prometheus and Grafana workflows, can we get better economics and performance with less operational drag?
Learning about the underlying architecture made us realize where the cost and scalability differences come from. Understanding that made us try it out.
Kunal Khandelwal
Lead, Infrastructure & Security at CureFit
Three Reasons to Say No
Any infra team evaluating observability vendors asks roughly the same three questions.
1) Can it handle our scale?
CureFit ingests millions of time series every hour across hundreds of services. Monitoring is not "nice to have" infrastructure.
2) Will this vendor still be here in two years?
Observability is crowded. New logos arrive every quarter.
3) Are we signing up for lock-in?
CureFit had intentionally kept Prometheus Alertmanager local to stay portable.
Those concerns cleared for concrete reasons, not optimism:
- Existing Prometheus
remote_writeflow stayed intact. - Dashboards moved without rebuild because of Grafana compatibility.
- Alerting config imported directly with Prometheus Alertmanager compatibility and remains exportable.
The Migration Was Mostly One Line
The migration was mostly boring in the best possible way.
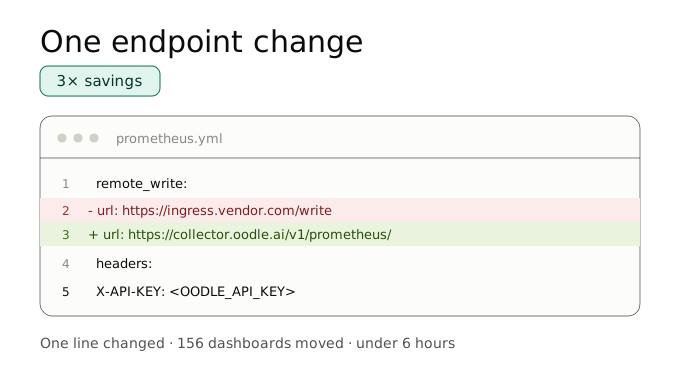
Prometheus was already pushing metrics via remote_write. CureFit changed the target endpoint and completed migration of endpoint, dashboards, alerts, and users in under six hours. No weekend freeze, no phased "war room," no retraining deck.
Here is the shape of the endpoint change:
remote_write:
  # Before
  - url: https://ingress.<previous-vendor>.com/prometheus/api/v1/write
    basic_auth:
      username: ${PROM_USER}
      password: ${PROM_PASS}

  # After
  - url: https://<customer>.collector.oodle.ai/v1/prometheus/
    name: oodle-remote-write
    headers:
      X-API-KEY: <OODLE_API_KEY>
Because Oodle is Grafana-compatible, all 156 dashboards came over as-is.
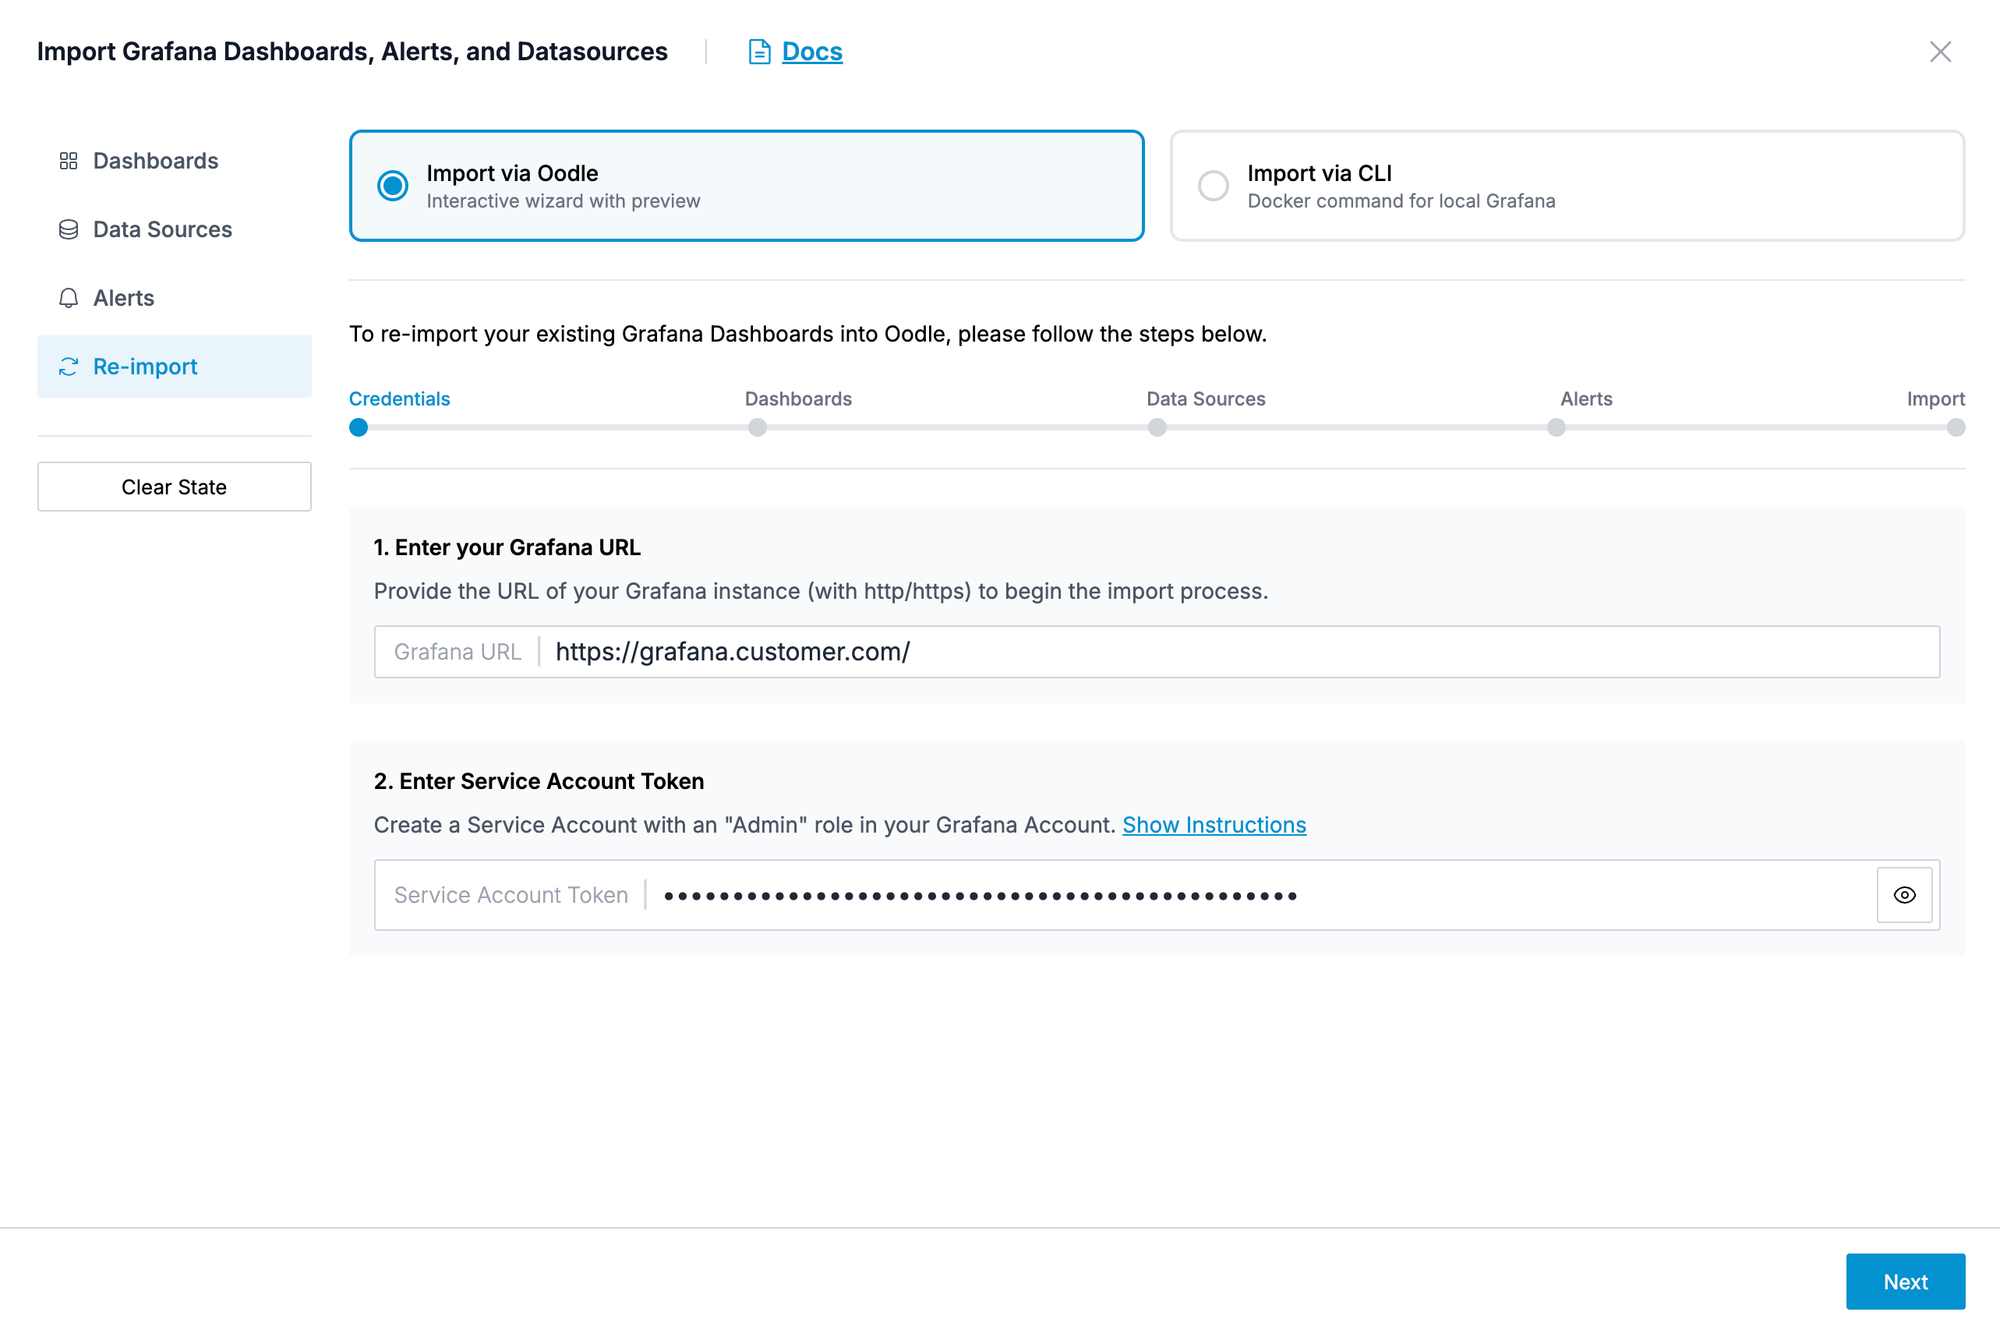
Alerting remained portable too. CureFit had run Prometheus Alertmanager locally by design. Oodle's managed alerting is Prometheus Alertmanager-compatible, so routing, Slack integrations, paging hooks, and webhook logic imported without rewriting.
The experience did not change much, just the endpoint did. Everything just loaded much faster, even the very heavy dashboards. That was delightful to see.
Kunal Khandelwal
Lead, Infrastructure & Security at CureFit
Private Connectivity, Different Unit Economics
When you ship high-cardinality metrics out of a VPC continuously, transfer pricing matters as much as storage pricing.
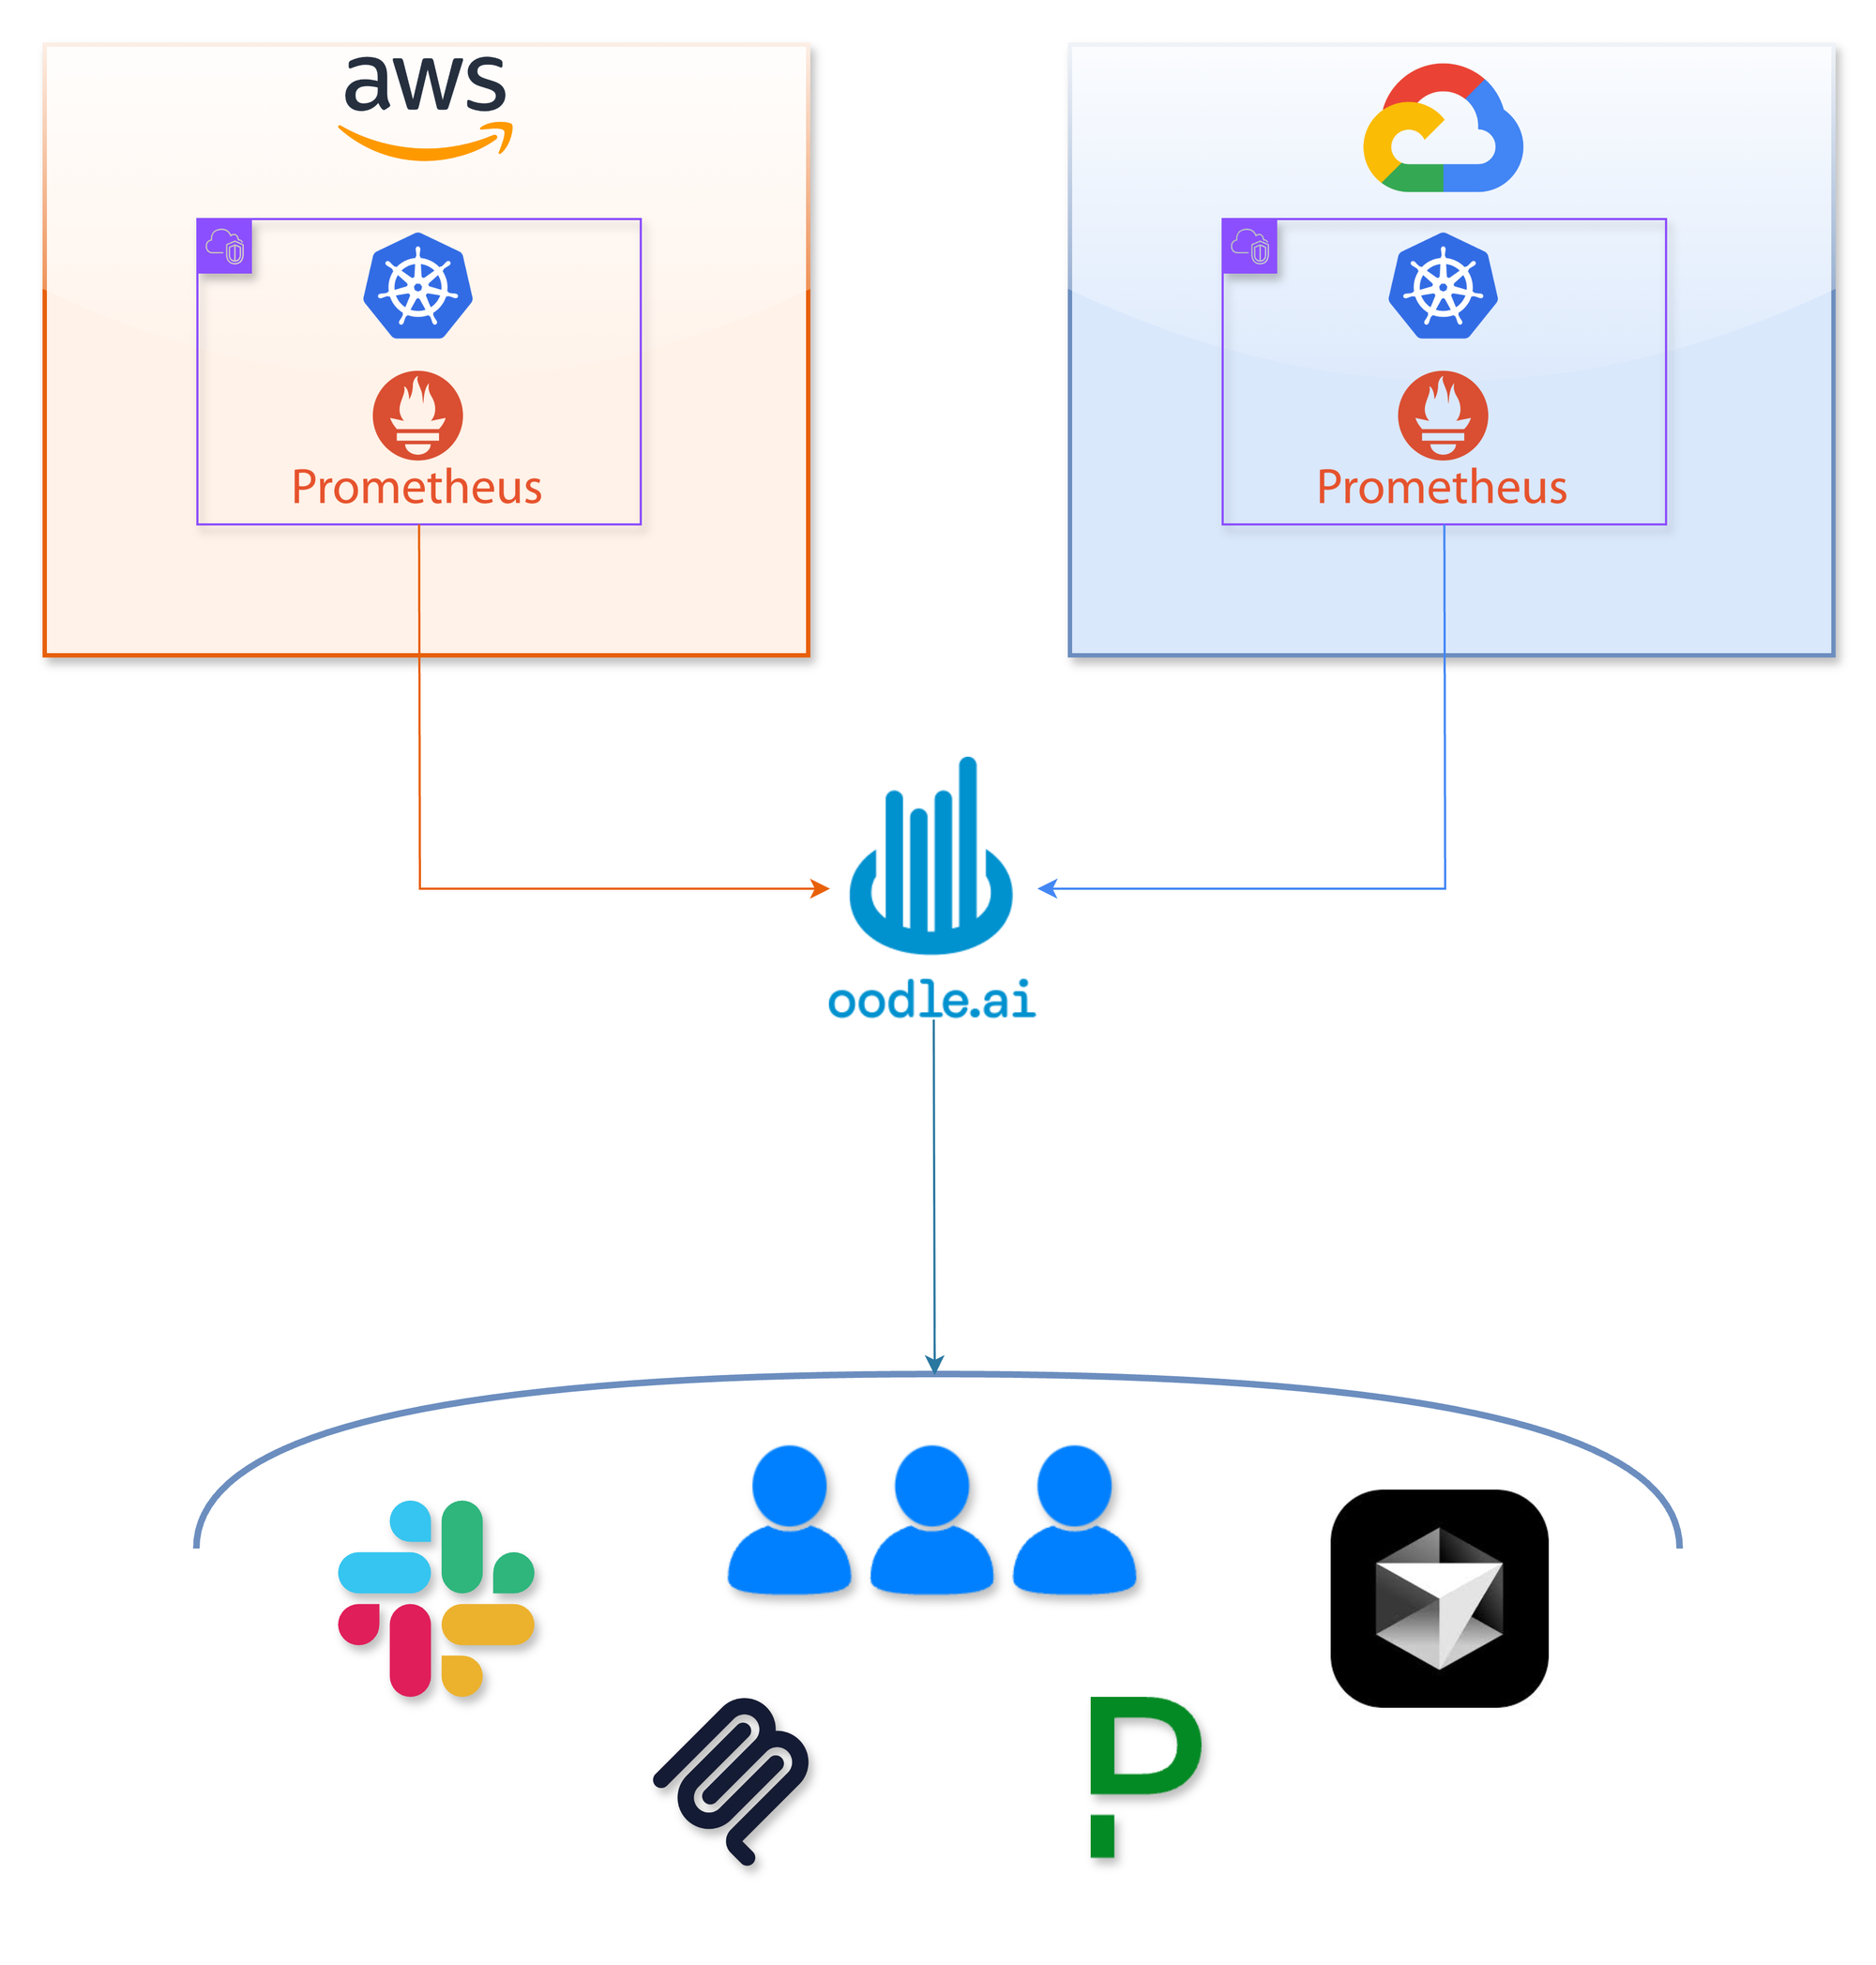
Oodle set up connectivity through AWS PrivateLink for CureFit (via VPC endpoint), so telemetry traffic stays on AWS private networking.
It is not "free." It is usually cheaper and more predictable at scale.
AWS unit-price comparison (prices may vary based on region):
- Public internet data transfer out can be around
$0.09/GB. - NAT Gateway processing is around
$0.045/GB - PrivateLink data processing is often around
$0.01/GB, plus endpoint hourly charges (for example, around$0.01per AZ-hour).
Actual bills depend on region, architecture, AZ count, and traffic profile. The key point is unit economics improve materially.
CureFit's architecture with Oodle
What Changed After the Switch
CureFit expected "same experience, lower cost." They got that, plus a few second-order effects.
Faster dashboards changed behavior.
Heavy dashboards loaded faster, and metric usage expanded across teams.
After we moved, the adoption of metrics increased. A lot of important flows now consume metrics: error rates, scaling decisions, hardware metrics. These things are configured now, which is good to see.
Kunal Khandelwal
Lead, Infrastructure & Security at CureFit
The Prometheus footprint got lighter.
With more monitoring operations managed on Oodle's side, CureFit reduced collector-side overhead and maintenance chores.
Access control became straightforward.
Per-user logins and role-based access shipped without extra workarounds.
Pricing aligned better with usage.
CureFit reported 3x lower metrics spend after migration, without reducing retention or trimming useful telemetry.
Stable and Growing
Eighteen months is enough time for weak assumptions to fail. During that period, CureFit grew in services, telemetry volume, and team size.
The migration did not trap them in proprietary workflows. Their Prometheus + Grafana operating model stayed familiar, and alerting remained compatible with standard formats.
There were a lot of delightful things that came along. Not just cost, but the entire user experience. Things loading faster, everything working all the time.
Kunal Khandelwal
Lead, Infrastructure & Security at CureFit
Kunal's framing evolved over time:
They are a considerable player in full-stack observability. Right there with the tools you are probably already using.
Kunal Khandelwal
Lead, Infrastructure & Security at CureFit
Next: Logs, APM and Anomaly Detection
CureFit started with metrics and is now expanding into Logs, APM and anomaly detection.
The logic is simple: more signals in one place produce better context. Metrics tell you something is wrong. Logs and traces tell you where. Anomaly detection catches patterns nobody encoded into static thresholds.
My favorite has to be the AI capabilities. Instead of going to a dashboard, you can just ask things. We're looking towards a day where you type in a symptom and it figures out everything for you.
Kunal Khandelwal
Lead, Infrastructure & Security at CureFit
For CureFit, this was a controlled migration. One endpoint change, same operational habits, better price-performance, and fewer infrastructure chores.
That is usually how good platform decisions look in real life: less drama, fewer tabs, and one less system your team has to babysit at midnight.