
How we achieved $10/million agent spans


At Oodle we built a new high performance, low cost database backed by object storage for each kind of observability signal - logs, metrics and traces. The design of the database is covered in more detailed in this blog. Because we designed this database specifically for observability data, we were able to make architectural decisions which makes us 3-5x more cost efficient than other traditional observability alternatives, and 10x more cost efficient than other agent observability solutions. Hence the $10/million agent spans :)
Our core traces product has two main components - UX and the Database. Both of these needed significant changes for dealing with agent traces.
UX
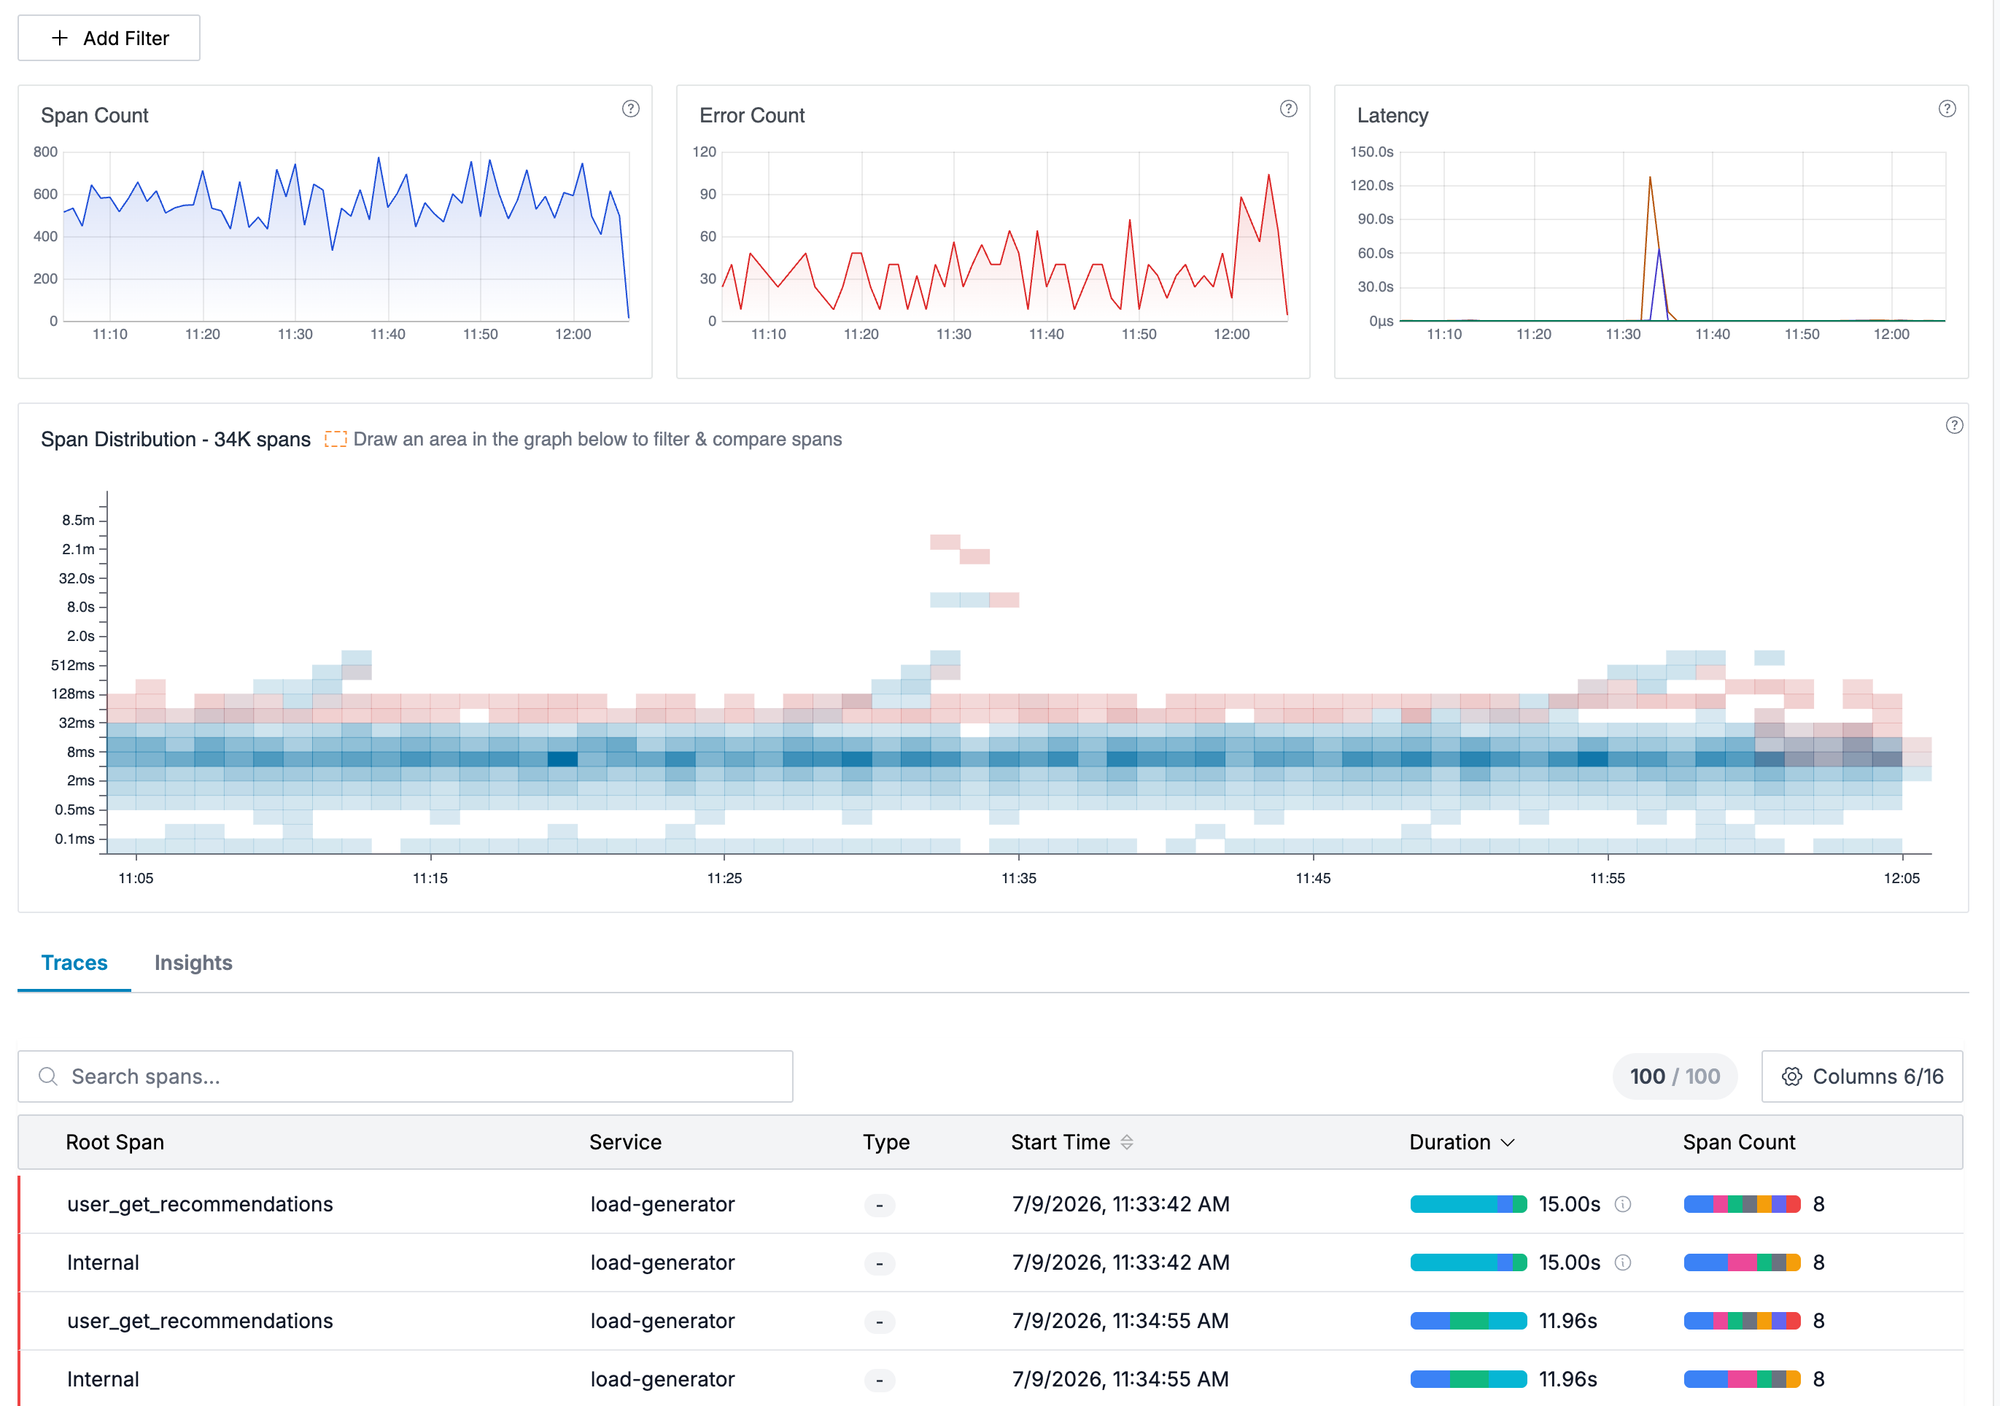
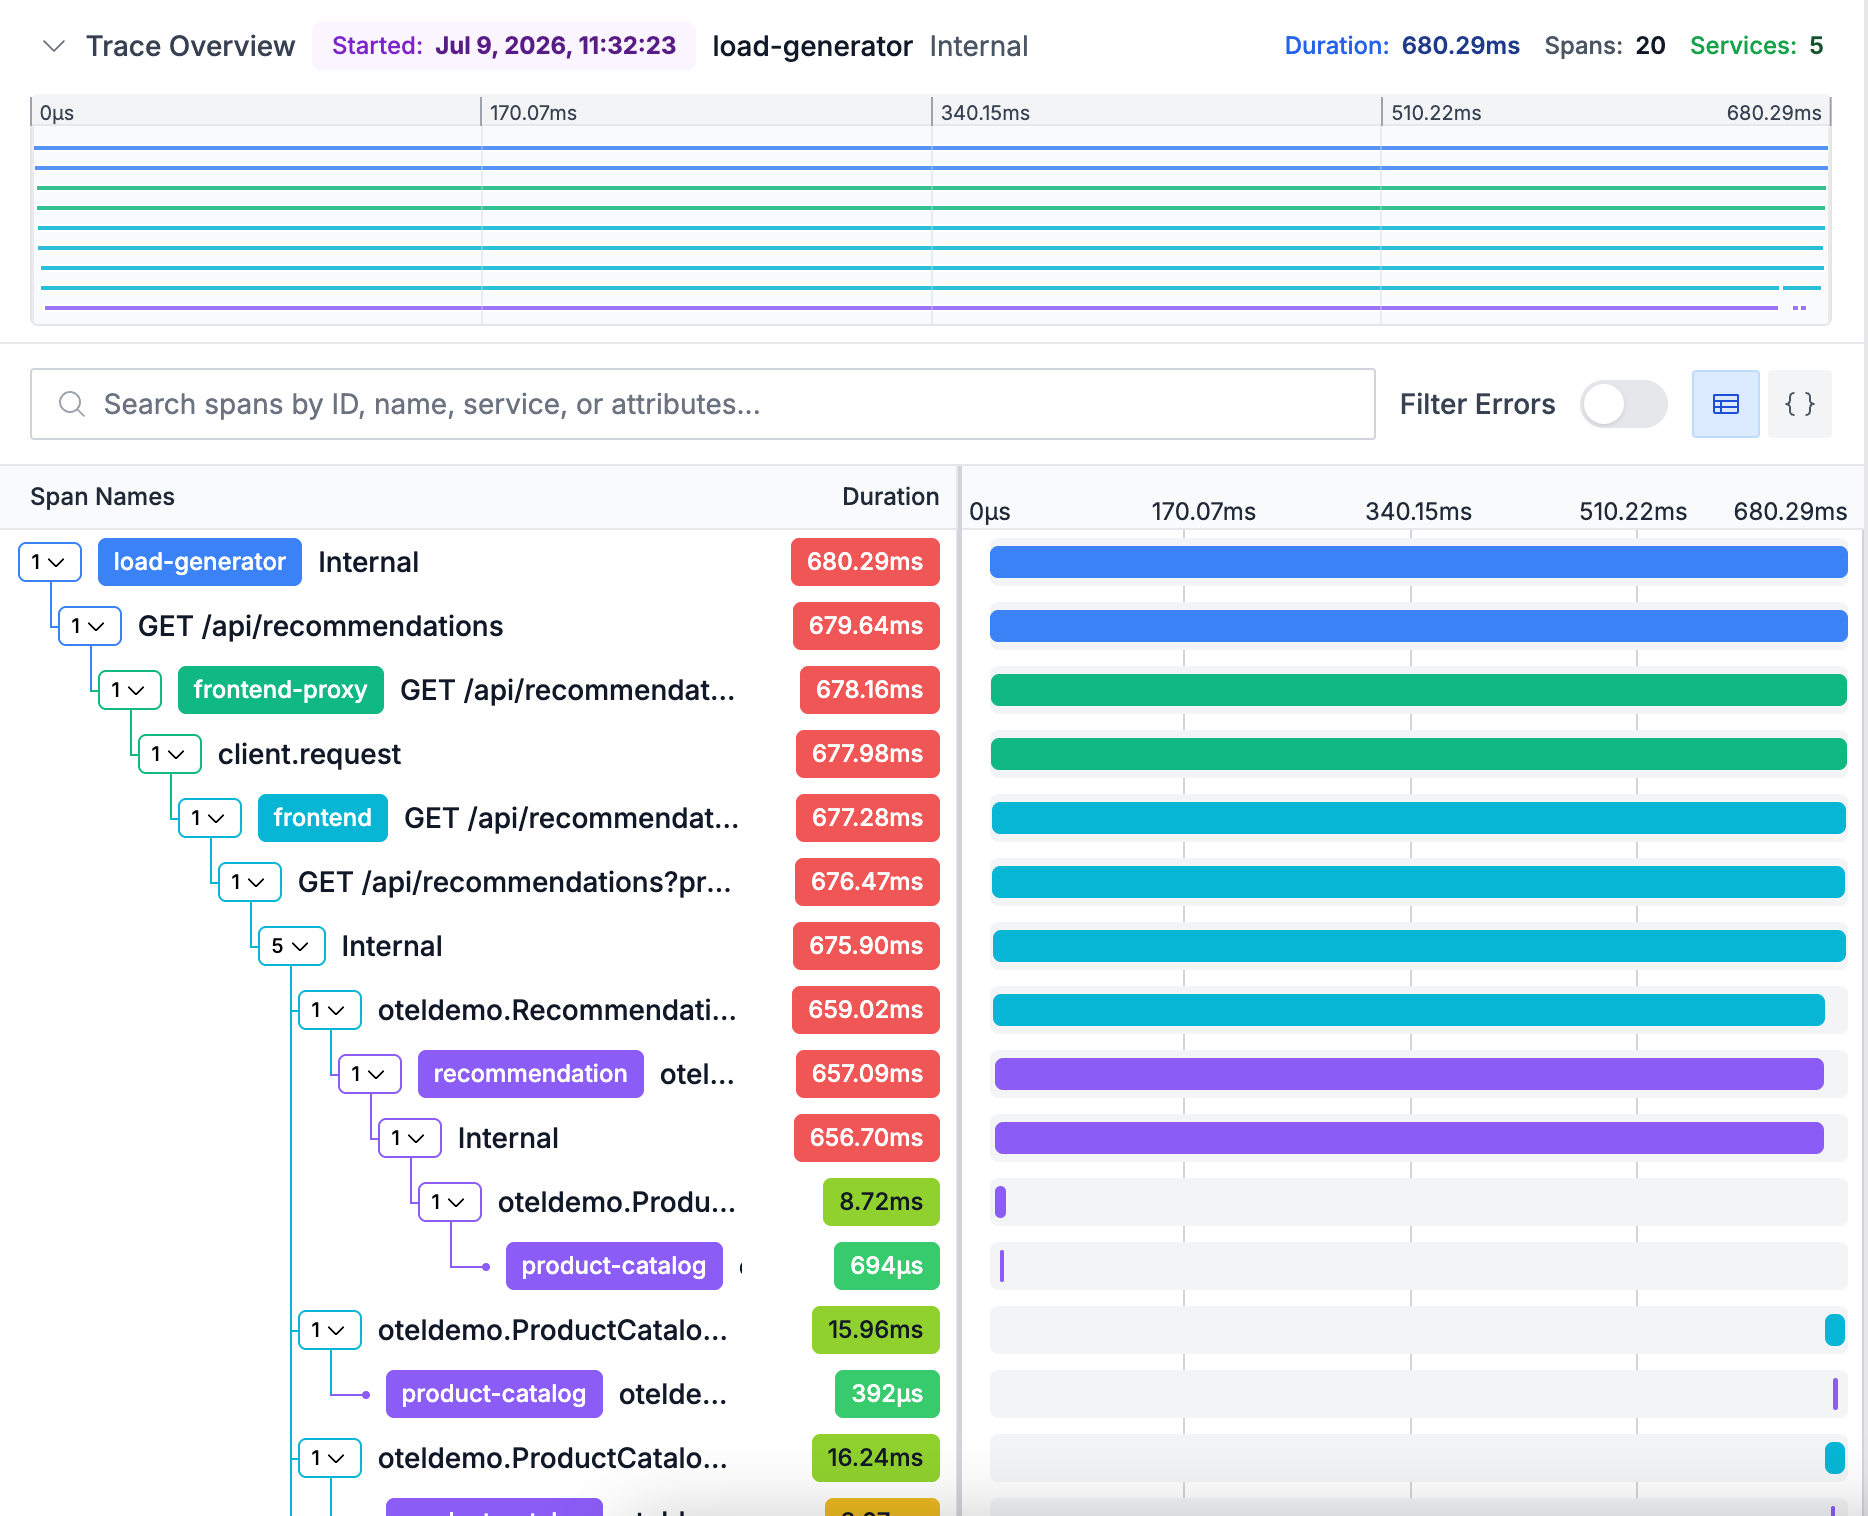
The UX we built was optimized to debug performance issues. Not a very useful visualization for agent traces.
Database
Data time-partitioned and stored in a custom columnar file format on object storage. The file format we initially designed for traces was optimized for storing "smaller" tag values - like pod, customer_id, trace_id etc.
Based on the user's query, a subset of objects relevant to the user query are processed using lambda functions. By design, this gives us extreme cost efficiency because storage is at S3 cost, and compute (lambda functions) only spins up when someone is actually querying the system.
In theory, it also allows for fast query performance because we can spin up 10k+ lambdas to handle a single query - we get massive parallelization.
But queries for agent traces was slow in our system :( - we had to make more optimizations! A common 7 day query run by one of our customers was taking 60s, but we were able to optimize it to < 2s
Agent traces are a different ballgame
When our customers started using Oodle for agent traces, our product had significant gaps in both the UX as well as the database engine. But the good part - we had the building blocks to create a cost efficient agent observability solution.
Insights into Agent behavior
What our customers wanted to see in agent traces was very different from traditional traces. They wanted
- User Prompt, System Prompt, model response, tools called
- Quick filters for session id, user id, model id
- Deep dive into sessions - which consist of multiple traces
- "Evals" - evaluate quality of traces. We have a different blog about our take on Evals
- Identify anomaly traces automatically which need a deeper look to optimize prompts, tools, models.
- Have a playground and run offline experiments to tune prompts
Query Performance
Agent traces had huge payloads - individual system prompts were in the order of 200KB+, compared to tags just being a few 100 bytes earlier. A 7 day query was taking ~60s with our old engine because it was not optimized for such large tags
How we adapted
New UX
We built a new UI for analyzing agent traces - focusing on conversations, tool calls, subagent orchestration and LLM costs. And added one click filtering for users, sessions.
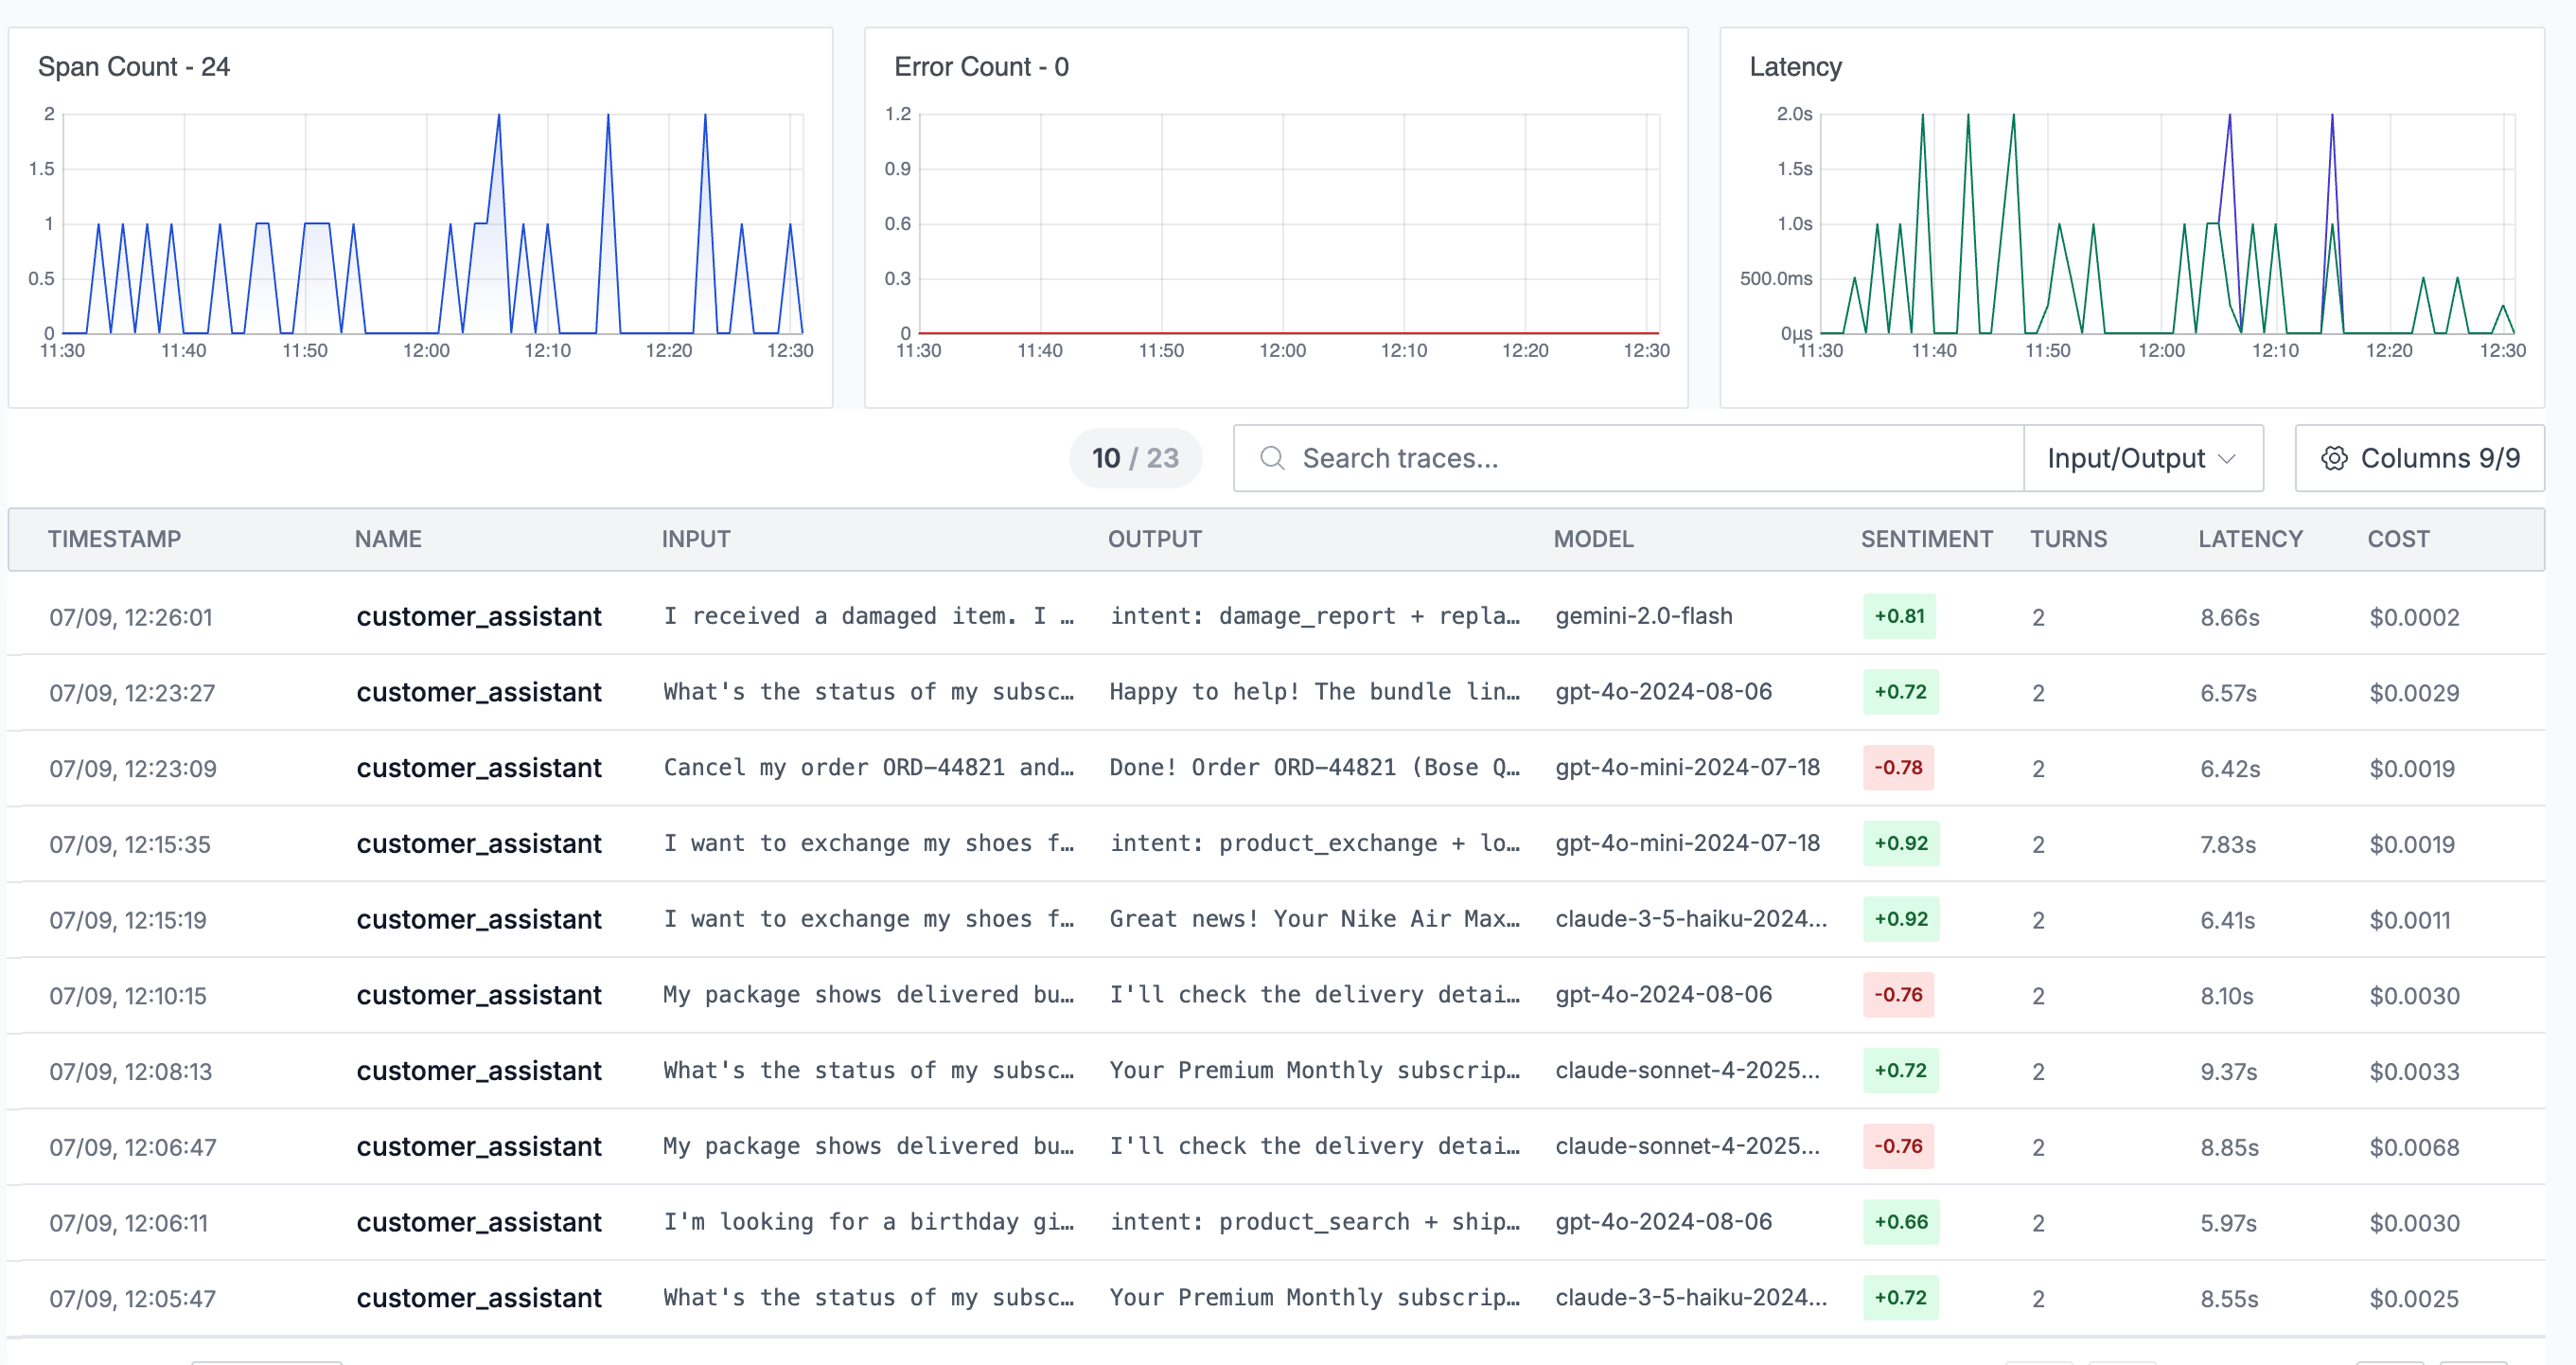
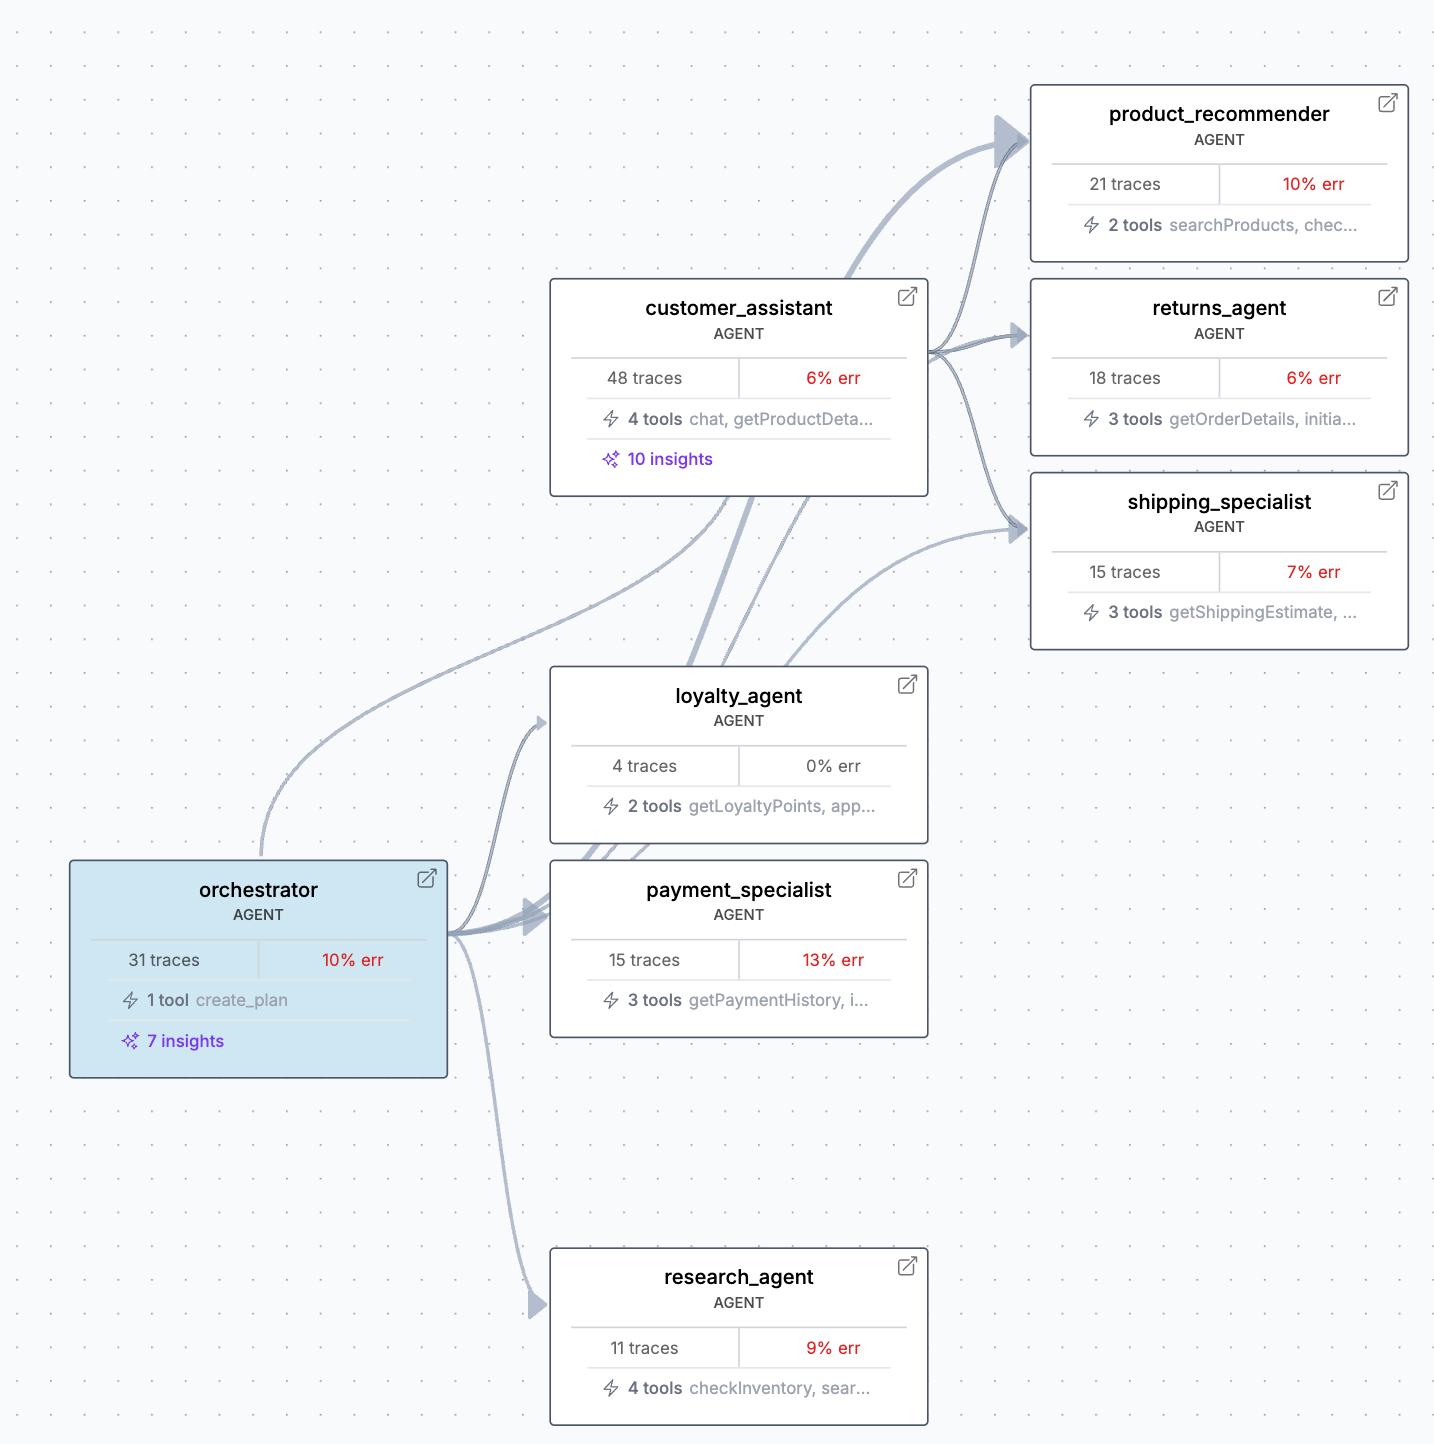
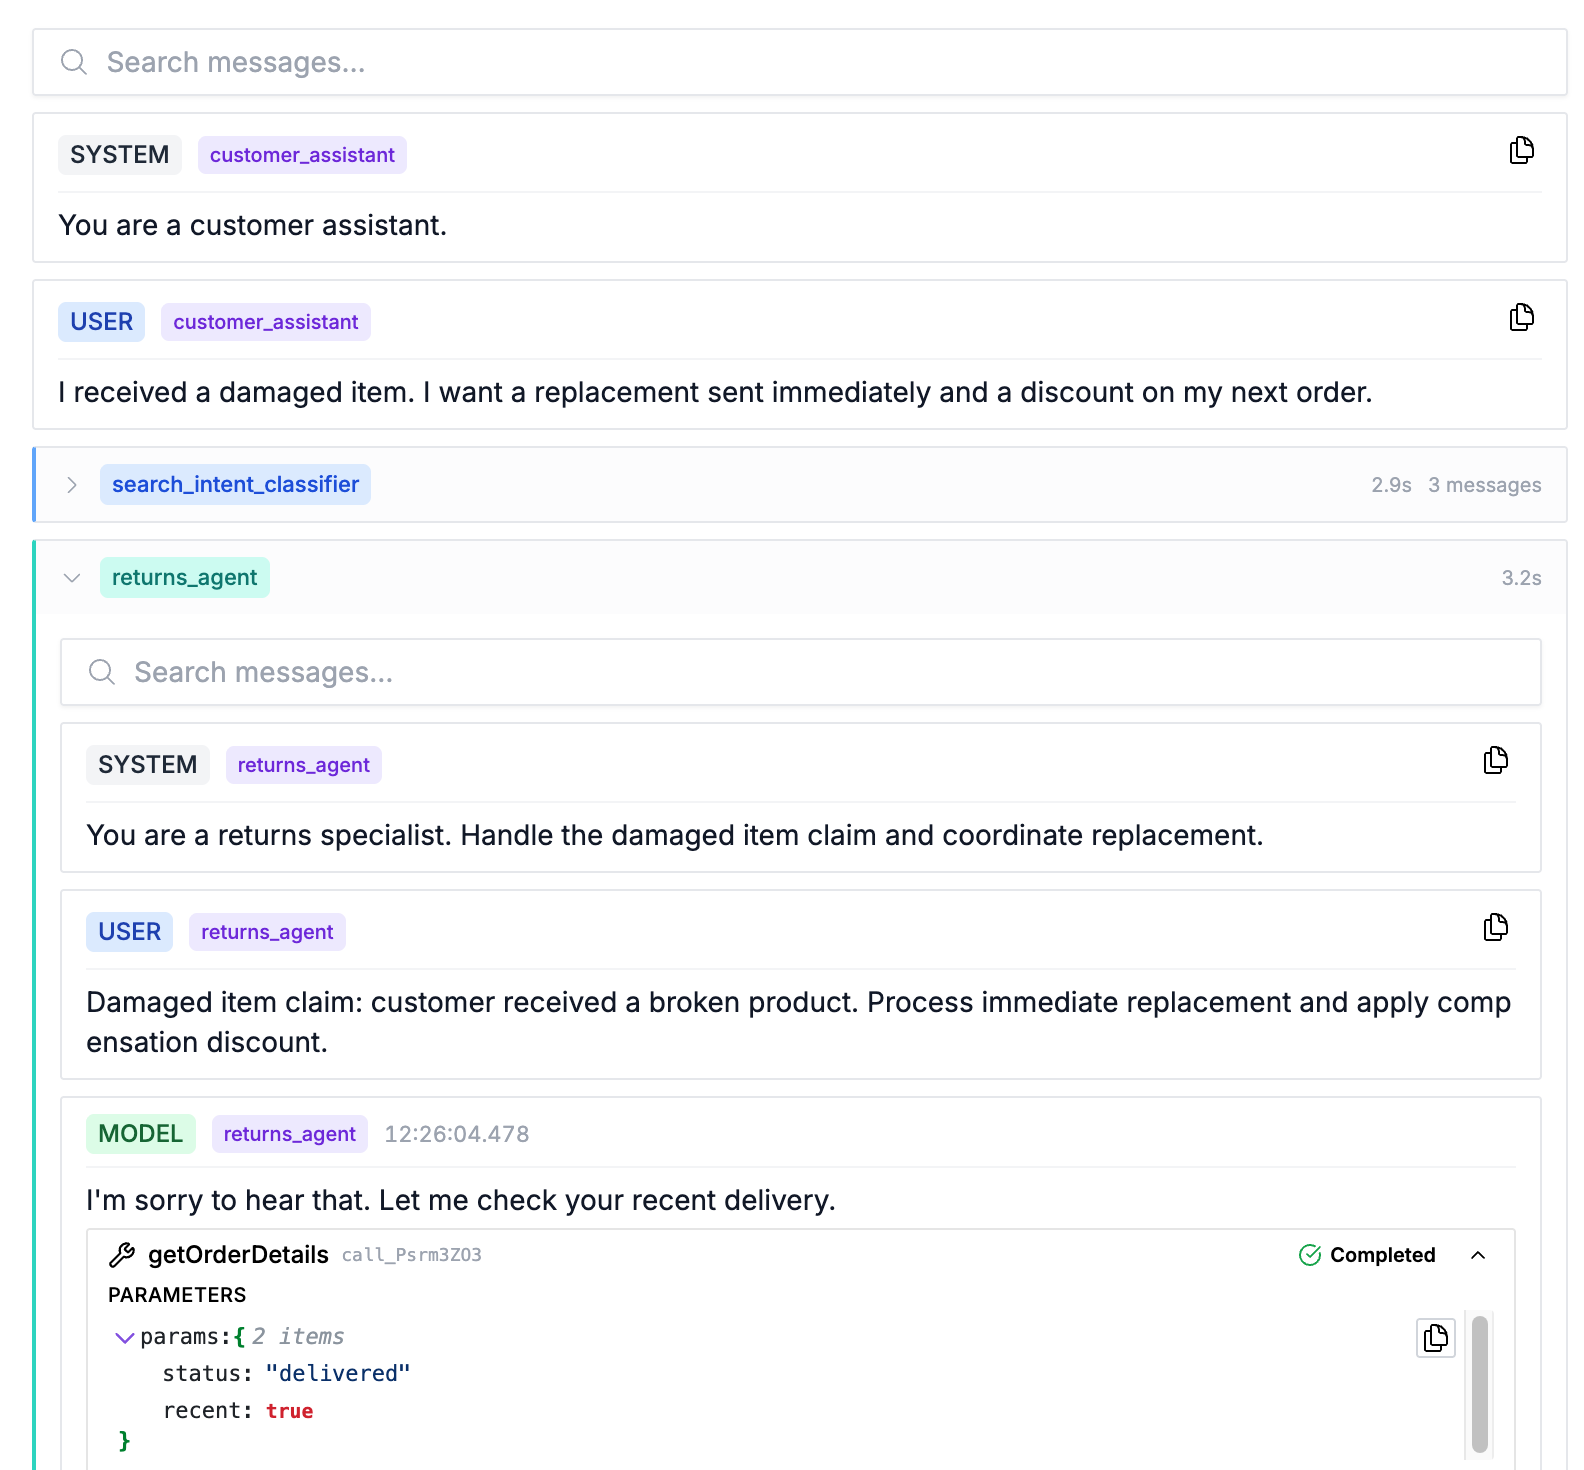
We also built additional functionality on top of our traces engine to evaluate quality of these agent traces - covered in detail in this blog.
Query performance
A majority of the performance improvements we made here was to optimize memory to handle large tags - like system prompt.
Our file format has a data file and a metadata file. The data file stores data in "row groups," each containing a batch of trace spans. String columns are dictionary-encoded: every unique string gets an integer ID, and the column stores those IDs instead of repeating the full string. This works great when strings are short, like pod_name=web-server-7b4f. The dictionary is tiny, the IDs compress well, reads are fast. These dictionaries are stored in the metadata file.
In agent traces, a single system prompt can be 200KB+. Thousands of unique prompts per row group meant the dictionary itself became massive. And we stored dictionaries inline with file metadata, so before reading a single row, you had to download and parse every dictionary for every column. Some metadata files ballooned to 300MB+, which caused both memory and performance issues in lambda functions.
Out-of-band dictionary storage
This was the single biggest win. Large dictionaries lived in the metadata file, which every lambda had to download in full, even for queries that only touched a couple of columns.
We moved large dictionaries into the data file, replacing them with a pointer in metadata. Now a lambda downloads the slim metadata, figures out which columns the query actually needs, and fetches only those dictionaries.
Lazy row group loading
Lambdas loaded all row groups into memory before processing any of them. Twenty large row groups meant 5+ GB peak memory and frequent OOM kills. This was not an issue before because row groups were tiny.
We switched to an iterator that loads row groups on demand. The query pipeline's backpressure naturally keeps only one or two alive at a time. Peak memory dropped from 5.3 GB to 1.3 GB.
The lambda memory leak
AWS Lambda reuses worker processes across invocations to avoid cold starts. Memory from one invocation sticks around for the next.
We found ~500 MB of decompression buffers surviving between invocations in Go's sync.Pool. Go's GC uses a two-generation scheme for pools: first GC moves items to a victim cache, second GC frees them. We were only running one GC cycle between invocations. Adding the second cycle dropped retained memory from ~500 MB to near 0.
This was a new learning for us on how lambda operates - that resources can leak between two independent invocations if AWS uses the same underlying worker.
Decode-only dictionary reader
Our trace compactor (which merges files) used the same dictionary reader as the query path. That reader builds a bidirectional map: string-to-ID for encoding and ID-to-string for decoding. Compaction only decodes, never encodes, but was paying for both maps. This was again not an issue before because dictionaries were small.
We added a new decode-only dictionary reader which skips the reverse map cut compactor peak heap from 2.8 GB to 1.4 GB, a 48% reduction.
Raising concurrency
The query patterns for agent traces are a bit different. Traditionally for operational traces, most queries are for the last day or last week.
For agent traces, our customers frequently did very long range queries - 3-6 months to find all traces for a specific user. We had to increase the limits on our per-query lambda rate-limiter to handle these long queries.
Where we ended up
| Metric | Before | After | Improvement |
|---|---|---|---|
| 7-day agent traces query latency | ~60s | <2s | 30x+ faster |
| Lambda peak memory | 5+ GB | 1.3 GB | 74%+ reduction |
| Query timeout rate | 1.4% | 0% | No timeouts! |
And since the database still uses the same primitives - object storage and lambda functions, we price agent observability at $10/million agent spans, orders of magnitude lower than alternatives.
Our customers are now super happy with both the product features as well as query performance of our agent observability offering!
Check out our live playground and let us know what you think! No signup needed: https://play.oodle.ai/genai/traces
See it in action on your own environment - signup for free at https://us1.oodle.ai/signup