Introducing Oodle AI: The fastest, most cost-efficient observability platform

Introduction
Oodle began with a simple idea inspired by our firsthand challenges scaling Rubrik from $5M to $600M in ARR: What if observability could be faster, more affordable, and—dare we say—actually enjoyable? Along the way, we faced big challenges, learned a lot, and built something we’re truly proud of. This blog is where we’ll share our journey—why we started Oodle, why it's radically different, the problems we’re solving for our customers, and how our passion for simplicity and innovation drives everything we do.
Over the past year, we’ve collaborated with our early adopters globally and onboarded unicorn-scale customers like Curefit, Fello, and WorkOrb. Across these customers, we are handling tens of million active time series per day and 5 billion+ data points per day in production workloads for several months.
Now, Vijay and I are thrilled to make Oodle available to everyone.
- High Scale Playground: live demo of speed, scale and cost-efficiency
- Oodle.ai: get started for free in minutes
What is Oodle?
Oodle is the fastest, most cost-efficient observability platform. It's a serverless, fully managed, drop-in replacement for Prometheus and ELK stack at scale. Oodle combines reliability and performance of enterprise-grade observability offerings with simplicity and cost-effectiveness of open source products. With our Dashboard-less debugging, Oodle helps engineering and DevOps teams resolve incidents 5 times faster at 1/10th the cost of traditional tools.
Here is why our customers love Oodle: (Check out our Wall of Love)


Problem - Why Take Action?
Metrics observability is a complete mess in many companies. This has been a widely accepted problem in various threads (Coinbase $65M/year bill, Why is Observability so expensive?, Benchmarks on observability spend, Observability is too damn expensive, DevOps.com: Observability costs are damn too high, cost crisis).
Let's take a look at the four core issues below:
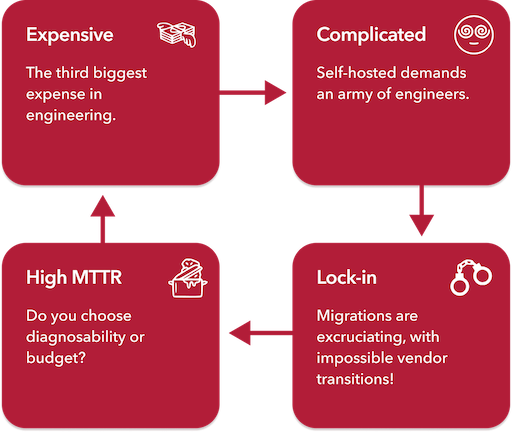
1. Observability is crazy expensive!
Companies are spending millions on observability and hiring whole teams to manage observability internally. Do you realize it is the 3rd highest engineering spend after people and cloud infrastructure cost? And it's growing 2x faster than your AWS bill. That's insane! What's even more insane? 95% of collected data is never queried. But when there's an incident you may not know what data will be useful beforehand.
2. Metrics observability is complicated!
Open-source tools like OpenTelemetry, Prometheus, and Grafana do a great job of giving you standards to avoid vendor lock-in, but here’s the catch: they require a ton of engineering resources to set up and maintain. Prometheus, for example, works well at first but starts struggling when you hit scales over 2 million unique time series an hour. And when that happens, outages and poor customer experiences follow.
You might turn to scaling options like Thanos, Cortex, or InfluxDB for temporary relief, but they come with their own set of headaches—disk failures, capacity planning, replication issues. Managing large time-series data is hard!
On the commercial side, companies like DataDog, Splunk, and Dynatrace offer full visibility but at a steep price. To keep costs in check, many teams scale back observability, wasting engineering time on workarounds instead of focusing on revenue-generating features. And the worst part? When you’re missing key metrics, investigating customer issues becomes a guessing game. Fixing this often means deploying code changes to production, which can take days or even weeks, by which time, the context is lost.
Why are engineers brainwashed to not send high cardinality metrics?
But the struggles don’t end there. Both open-source and commercial tools leave engineers overwhelmed by endless dashboards and alerts. As companies scale with more apps, micro-services, and containers, it only gets worse. The result? Silos form between engineers—best vs. entry-level—and on-call engineers lack a streamlined, one-stop command center to quickly resolve incidents.
And let's talk about pricing. Whether it’s based on nodes, seats, queries, custom metrics, add ons for container insights, or ingestion volume, it’s very complicated. Add in extra charges for overages, and it can feel like you're drowning in hidden costs.
Does pricing have to be a maze?
3. Metrics observability data is growing exponentially! and MTTR is going uphill.
Companies are forced to make hard choices between visibility and cost introducing business risk. Just like how data lakes grew by 10-100x, observability has become a data problem. Yet, most of the legacy observability solutions store this in three-way replicated expensive SSDs, pre-provision the compute based on peak expected load and index everything.
In addition, cardinality explosion is making it harder to operate complex time series databases because most of them use row-based storage but high cardinality queries do require columnar storage for fast performance. There are indeed some innovations around optimizing for scalability (e.g. Mimir, VictoriaMetrics, ClickHouse, M3DB, InfluxDB), but none of them were architected for cost and scale as first class citizens from Day 1. Because of lack of first class support for columnar storage, companies end up adopting multiple systems - one for low cardinality and another for high cardinality => which leads to more operational overhead.
To make matters worse, the legacy observability tools only offer linear pricing as you scale - which means if you revenue goes up by 3x, your observability bill goes up by 3x or more (sometimes a lot more if you are not careful). This is ridiculous.
We expect #engineers to scale at a lower pace than revenue. Why should the observability pricing scale linearly with data growth?
4. Metrics observability tools have annoying lock-ins!
Migrations are a nightmare. Switching vendors is never simple—you don’t really own your data, there’s not much open-source compatibility, and businesses think in quarters, years, not days or weeks. A lot of companies are so scarred by past migrations that they won’t even consider future ones. Open-source tools might give false illusion of no lock-in, but the key is true open-source compatibility: how easy is it to switch to open source standards like Prometheus or Grafana ? Understanding what a migration really involves shows how much this space needs to innovate.
Why is it a norm to spend months/quarters/years migrating away from your existing solution?
Existing Solutions: What's Been Tried So Far?
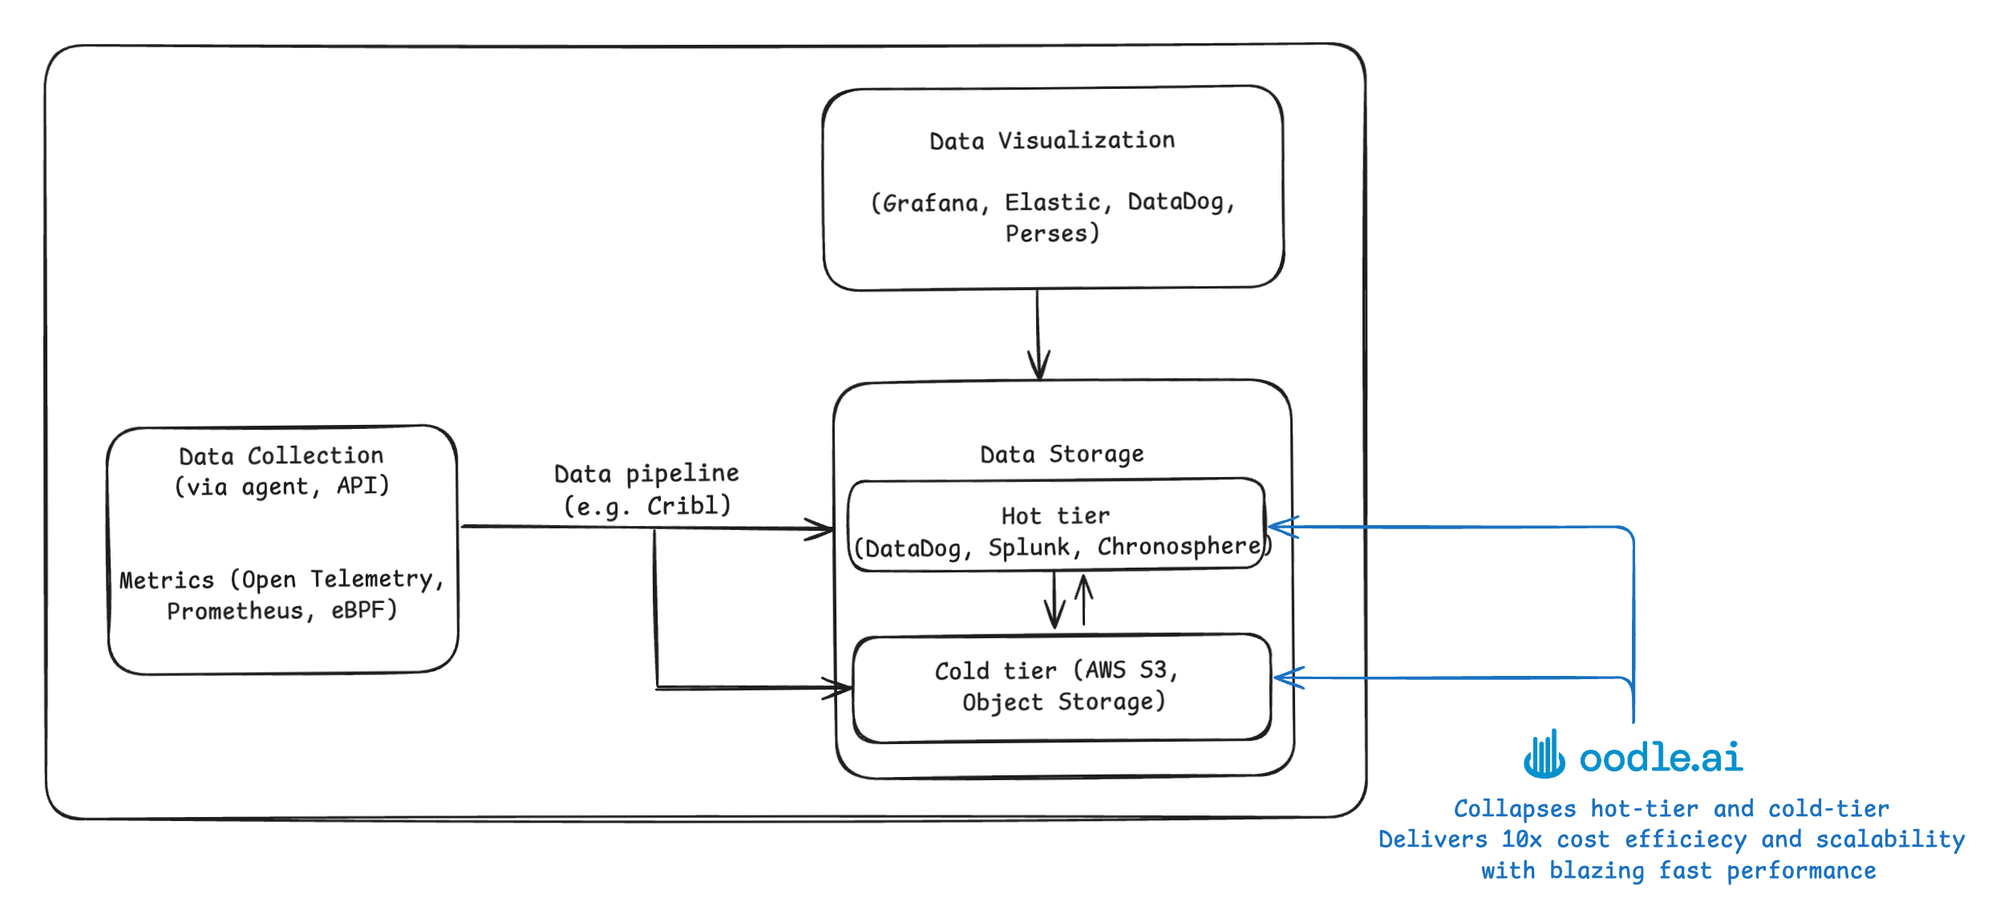
Let's look at the current state of the art across three key areas - storage, routing and intelligence layers shown in the diagram above [2].
Storage layer
The storage layer for time-series databases faces challenges in scalability, high cardinality, cost-efficiency, and operational complexity:
- Scalable Time-Series Databases: Options like InfluxDB, kDB, Victoria Metrics, TimeScale, Druid, and Pinot improve scalability but struggle with high cardinality, or operational overhead challenges. Operational complexity comes from handling data retention and replication, ensuring fault tolerance during failures or upgrades, balancing resource usage, configuration challenges, real-time ingestion, robust scaling strategies, advanced indexing, and proactive monitoring. On-prem solutions like Prometheus, M3DB, Thanos, and Cortex offer limited end-to-end observability.
- Separation of Storage and Compute: Platforms like Mimir leverage this architecture for scalability but lack serverless functionality and cost-efficiency by design.
- Tiered Storage: Helps manage costs (20-50% reduction) through separate hot and cold data tiers, but rapid data growth and engineering overhead persist. You need to trade off debugging speed for costs - queries to cold tier will be slow.
- Managed Prometheus: Managed services from AWS, GCP, and Azure reduce management effort but require additional tools (e.g., Grafana) and struggle with scalability, reliability and high cardinality issues.
- Hybrid BYOC Solutions: While open-source and "Bring Your Own Cloud" approaches may seem cost-effective, they shift the burden of infrastructure management to users, limiting shared cost benefits and adding complexity.
Routing Layer
Data pipelines (e.g., Adaptive Metrics, Chronosphere's control plane, Cribl) streamline data movement between sources and destinations, offering some cost reduction (10-50%). However, rapid data growth and optimization needs result in significant engineering overhead.
Intelligence Layer
Tools for Application Performance Monitoring (APM), integrated observability experience across all signals, and automated root cause analysis reduce Mean Time to Resolution (MTTR) for critical incidents. Emerging technologies like generative AI, knowledge graphs, and agentic workflows are driving innovation in this challenging but promising area.
Limitations of Legacy Architectures for Cloud Native and AI workloads
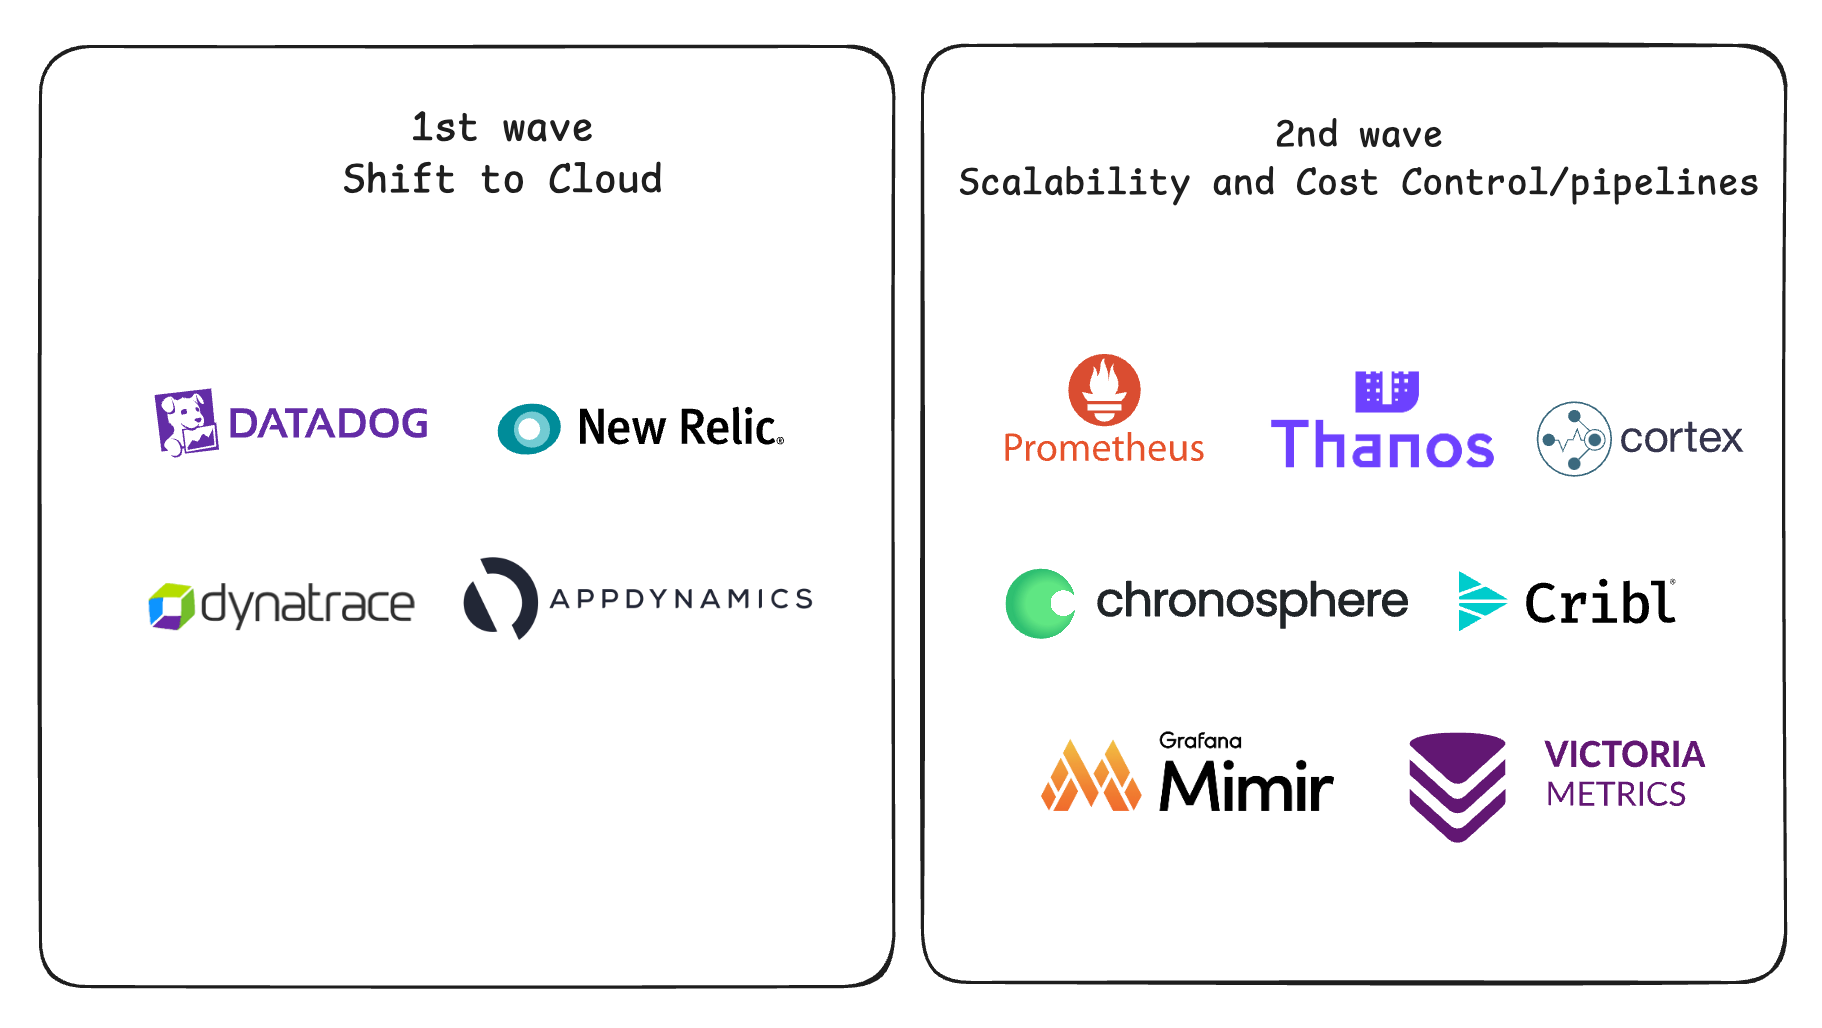
The diagram above shows the evolution of observability products. The first wave solved the observability pain points for out-of-the-box experience. Scalability, and data volume problems started to emerge. Second wave tried to tackle scale problem head-on and are handling data volume challenges partially. There is more innovation happening, but for the most part, organizations are still struggling with cost and debugging speed challenges.
The key issues are, these tools are:
- Not architected for cost-efficiency, instead for scalability and experience
- Not suitable for high-cardinality use cases because of row-based storage
- Expensive: store on SSDs and need replication. And replication adds more cost!
- Slow: use object storage for long-term backup.
- Always running compute even when there are no queries on the system
- Based on lift-and-shift on-prem architectures
Why Us?
How we came together
Vijay was a distributed systems expert and was a tech lead for peta-byte scale Rubrik file system that is currently supporting 5k+ enterprise customers. While there, he helped architect and optimize various file formats at the storage, and metadata layers. He has also helped build an enterprise grade highly-scalable and low-latency file system from ground up on top of cloud object storage. We’d worked together in the same team for several years on Rubrik Security Cloud platform teams, and really enjoyed working with each other. We knew we wanted to build an enduring company together because of our aligned values and ambitions.
Cost and Complexity challenges at Rubrik
We personally experienced these pain points firsthand for five years as a buyer of a high-scale company at Rubrik (NYSE: RBRK) while we were scaling from <$5M to $600M+ in ARR. Our observability bills grew by more than an order of magnitude over four years. We led multiple (painful) migrations and evaluated several open-source tools and commercial vendors.
First migration from open source (InfluxDB/Grafana) to SignalFx/Splunk took 3-6 months. Second migration from Splunk/SignalFx took 6+ months. One of our sister teams has had challenges around time to resolution, and missing metrics (again due to cost and scale). In fact, one of our sister teams tried to build in house cost-efficient solution from ground up with a dedicated team for 2 years, but it didn’t fly as expected due to team churn and shifting business priorities.
Yet, despite all these efforts, we were left stranded with none of them addressing the needs around cost, scale and debugging speed over these five years. They kept on appearing in different forms over the years. We heard more and more of these comments from 50+ observability leaders in the industry, further validating that it's a widespread problem.
Why Now?
We felt that there had to be a better way - so we asked ourselves a few questions:
Scale: what if we were to design observability for the scale of internet from first principles based on truly cloud native primitives - Serverless, S3? (starting with metrics).
Cost-efficient: what if we could architect for radically better cost-efficiency, AND performance at any scale AND operational simplicity from Day 1?
Speed: Is it possible to achieve radically lower MTTR leveraging statistical analysis and generative AI? what would it take for every engineer to be as good as your best engineer? Is it possible to create dynamic dashboards on the fly for alerts and spikes?
High Cardinality: what if engineers don’t have to think about high cardinality when ingesting metrics? what if all the metrics that they ever needed were already available without waiting for any code changes for weeks, and there are no limits to type of queries they could ask for? when you ingest into data warehouse, you don’t think about cardinality, your first reaction is "just send". why is it not possible to achieve similar design in observability?
Simplicity: Is it possible to achieve limitless scale with zero operational overhead? What if migrations were one-click as opposed to months/years of effort? Is it possible to simplify pricing based on a single dimension? What if we could combine the benefits of simplicity, compatibility, no lock-in, open source compatible with the reliability, and performance of high-end observability products? Why not enterprise-grade observability at the cost of open source?
Our answer is Oodle.
We strongly believe this new serverless architecture built from ground up on top of object storage will become the new standard for observability, unlocking new use cases not possible before. It will go a long way towards delivering incredible debugging speed, cost-efficiency and simplicity to our customers.
What Makes Oodle Different?
Oodle’s Core Innovations
- Radical Cost-Efficiency
Oodle leverages cloud-native primitives like Serverless and S3, designed for cost optimization from the ground up. Its mostly stateless, disk-free architecture avoids common egress costs through an Availability Zone-aware design. - Dashboard-less Debugging: Faster Alert Resolution
Oodle enables on-call engineers to resolve alerts quickly, answering any query at any cardinality within seconds. AI-powered insights dynamically generate dashboards for spikes or alerts, cutting MTTR by 5x.
Purpose-Built for Observability
Observability data differs from analytical data: it focuses on recent data, is highly compressible, and largely not queried at all. Queries demand sub-3-second p99 latency with complex aggregations. Oodle’s custom datastore exploits these properties with a unified speed layer atop object storage, purpose-built for observability.
No Need for Tiered Storage or Legacy Overhead
Oodle eliminates hot/cold tiering, collapsing everything into a single, efficient layer. Unlike traditional systems with 3-way SSD replication or legacy architectures, Oodle emphasizes operational simplicity and easy migration.
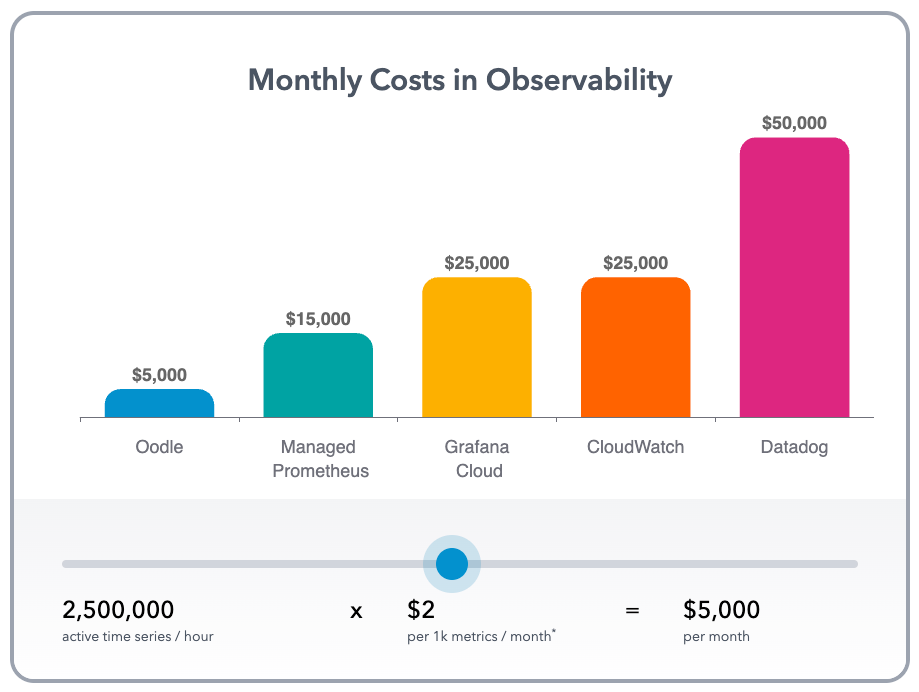
Shockingly Simple Pricing
Oodle’s pricing is based solely on the number of active time series per hour. Its sub-linear pricing ensures growth without sticker shock.
The Magic Behind Oodle
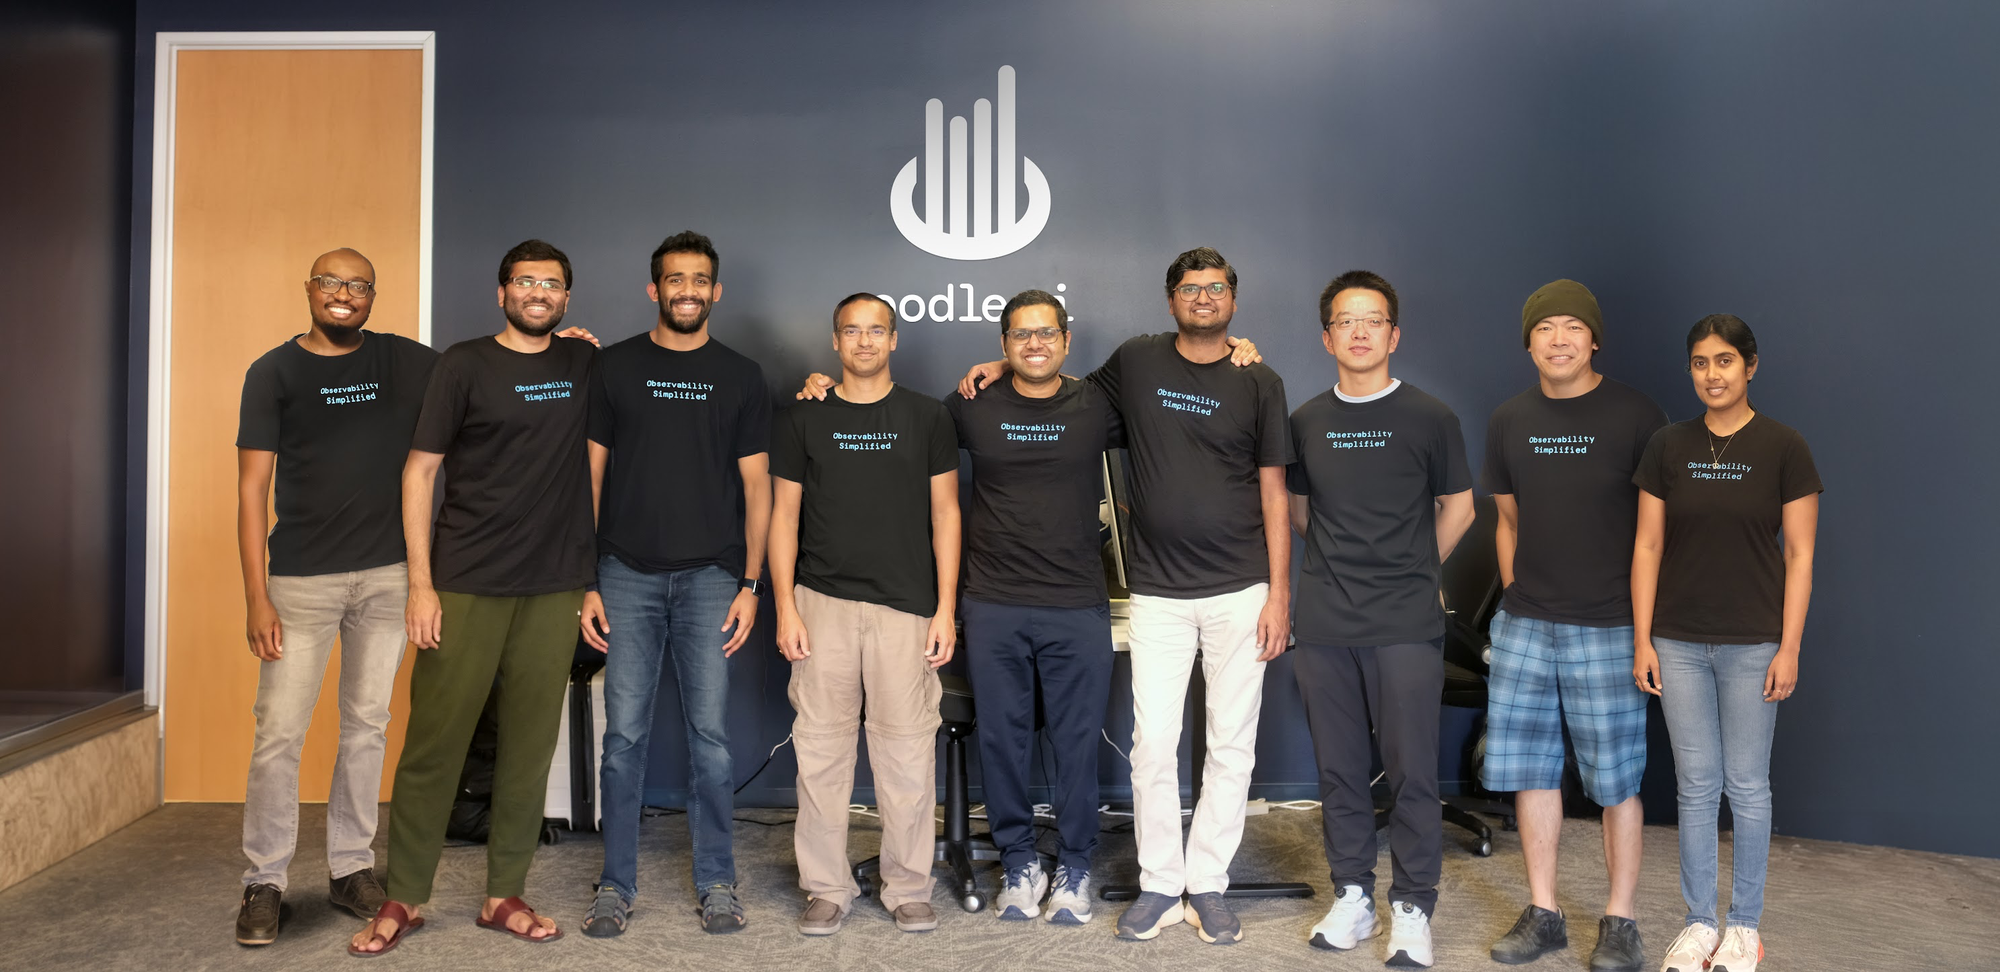
The real magic behind Oodle is the people - Akhilesh, Cal, Jerry, Gaurav, Prameela, Sujeet, Tao. Over the last year, Vijay and I are very fortunate to be working with this incredible team where we are pushing the boundaries on what’s possible. This team has built and launched world-class products like Rubrik Security Cloud, AWS S3, DynamoDB, SignalFx and Snowhouse at Snowflake. The team has not only co-founded YCombinator-backed startups but also understands how to scale them. We fully embrace diversity of thought and perspective. It’s not just work, our in-person office culture, daily lunches, traveling together for conferences help us connect with each other on a more personal level, and appreciate our differences.
We discussed about how Oodle is taking a new approach to observability at SREDay talk. Here is a blog post where Vijay, Oodle co-founder, talks about our game changing cloud native architecture.
Heartfelt Thank You
to everyone who’s supported us in this journey so far!
Many thanks to Ashmeet Sidana (Engineering Capital), Arpan Shah (Pear.VC), and Kevin Mahaffey (SNR.VC) and a number of prolific angel investors who believed in us with their first checks. Anurag Gupta has been an incredible mentor. Andrew Miklas's perspectives on the market and the focus areas have been extremely valuable. Thanks to our early adopter customers and champions for taking a chance on us. We are incredibly grateful and excited to be working with you. It takes a village to build a startup, so a big thank you for everyone who’s helped us in every little way!
Our Mission
Everything we do, we believe in challenging the status quo. The way we challenge the status quo is by making observability radically simple, fast and cost-efficient for engineering and DevOps teams, thereby accelerating innovation for our customers. We obsess over invariants below:
- Customers always want lower time to resolution for incidents
- Customers always love fast and scalable observability solutions
- Customers always love simple, easy to use products
- Customers always want lower prices
Welcome to the world of radically better observability!
Let’s go!
Vijay and Kiran (Oodle AI co-founders)
References
- Observability is too expensive: Coinbase $65M/year bill, Why is Observability so expensive? , here , here , cost crisis
- Observability costs are exceeding > 25-30% of cloud bill
- Open Source vs SaaS vs BYOC
- Investor perspectives: Evolving Observability markets, Observability Crisis
- Cloud Disks are expensive: EBS Pricing vs S3 Pricing (math on pricing)
- Jim Colins, Built to last - https://www.amazon.com/Built-Last-Successful-Visionary-Essentials/dp/0060516402
- Technical talk at SREDay on Oodle's new approach to observablity
Assumptions and Considerations
- [1] In this post
- We will exclusively focus on metrics observability (in the interest of scope). Technical speaking, one could argue that unified observability with logs, metrics and traces/APM is also important. We will tackle this in a different blog post how Oodle fits into the integrated experience.
- How we leverage Oodle AI insights is not covered in this blog to to keep the scope focussed on the specific pain points.
- [2] Products described in the various layers (storage, routing, intelligence layers) are not comprehensive. This is just to give an idea, if we missed anything important, please let us know.


