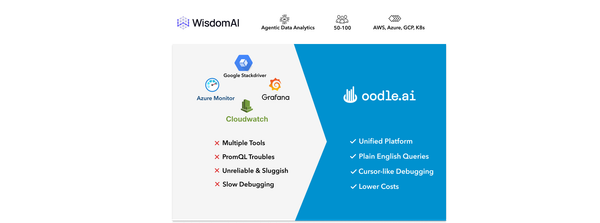
Case Studies Three Clouds, One AI Assistant: How Wisdom AI Unified Observability on Oodle 🌟Wisdom AI runs customer deployments across AWS, GCP, and Azure. Their observability was scattered: AWS CloudWatch for one account, GCP Cloud Logging for another, Azure Monitor for a third. Engineers resorted to CLI scripts just to search logs. Self-hosted Grafana kept crashing. Creating dashboards/alerts were procrastinated due to PromQL
product Meet Oodle: Unified and AI-Native Observability You can watch Oodle's Unified AI-assisted debugging experience on youtube. Production is down! You open your laptop and start the familiar dance: An API timeout? Check metrics for the spike, switch to logs for the error, open traces for the slow dependency — three tools, three contexts, one incident.
product Dashboards are Dead! Say you are a modern software engineer used to getting access to relevant information at your fingertips, you are grappling with questions around your Observability tools: “Why am I still relying on static dashboards in an era where everything else is dynamic and easy to use?” “Why is my work
product Scaling Prometheus: From Single Node to Enterprise-Grade Observability Prometheus is an open-source monitoring solution that provides a streamlined way to store metrics data, query metrics using PromQL, and set up alerting. It has become the de-facto standard for monitoring infrastructure and applications. * Easy to setup: Prometheus is straightforward to deploy - simply run a single prometheus binary and
Go Profiling in Production At Oodle, we use Golang for our backend services. In an earlier blog post (Go faster!), we discussed optimization techniques for performance and scale, with a specific focus on reducing memory allocations. In this post, we'll explore the profiling tools we use. Golang provides a rich set of