
A Platform Engineer's guide for Datadog migration
Datadog users often have a love-hate relationship with the platform. It takes a lot of continuous investment of tuning the indexing configs, splitting up logs between production and dev environments to keep the relationship alive, until a fine day when CFO says it's enough.

If you have used Datadog for few years, you would be used to tight-rope dance it requires to balance cost and visibility. A number of common practices I have seen in the field:
- Selectively index logs
- Reduce retention period for logs
- Keep production data in Datadog, and move non-prod data to open-source stack.
- Reduce custom metrics
- Run automations to turn on/off telemetry flow to Datadog in less critical hours.
All of these are the balancing acts needed to keep costs under a check. These measures do end up reducing the Datadog bill, but, at the same time, they also reduce visibility you have on your systems as well as more complexity you need to maintain (open-source stack, older logs in another system).
This post is for you if you are considering migrating from Datadog. It gives a run through of various aspects you need to think when considering your alternatives.
What signals are you emitting?
Map the signals you are using in Datadog. Your datadog invoice lists the various line items which you need to think about:
| Line Item | Product Line |
|---|---|
| Infra hosts, Custom Metrics, Containers | Metrics |
| APM Hosts, Ingested Spans, Indexed Spans | APM |
| Ingested Logs, Indexed Logs | Logs |
| Agent Observability Spans | Agent Observability |
First decision to be made is whether to use a single tool for all product lines or separate tools. My recommendation would be to not compromise on unified observability - your app teams and their coding agents will thank you later!
Next, let's look at how all this data is getting ingested into Datadog and what options we have for alternatives.
Ingestion Path(s): which pipes to replace?
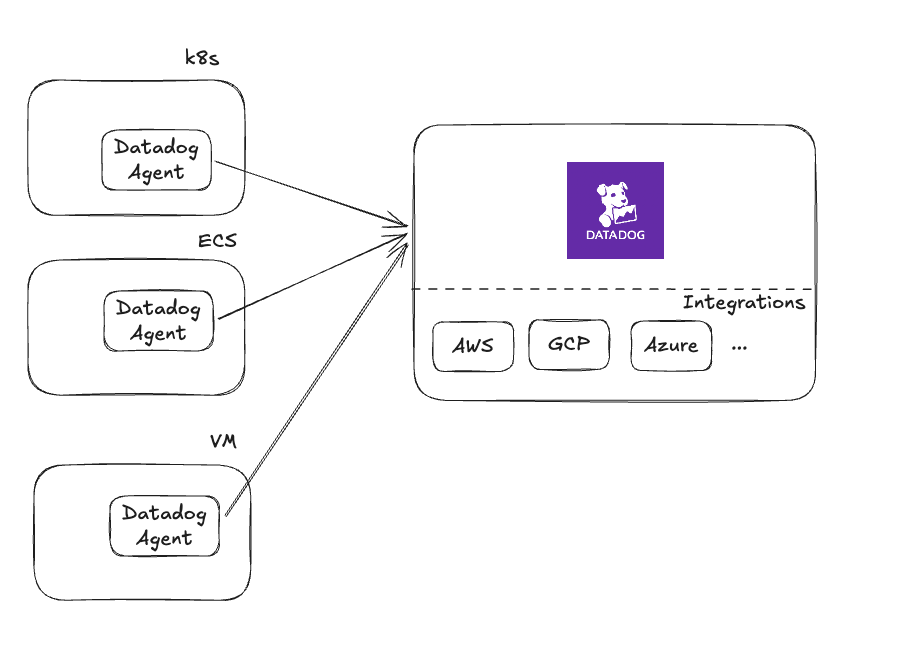
There are two primary sources of data ingestion into Datadog:
- Datadog agent - ships metrics, APM, logs to Datadog
- Integrations - natively supported integrations within Datadog.
For each ingestion pipe, check whether the alternatives you are considering support:
- Ingesting from the datadog agent. If this is supported, then data ingestion becomes a configuration change in the datadog agent. Otherwise, you would need to replace the datadog agent with open-source collectors like prometheus, OpenTelemetry collectors - which is right direction for the long term to move to a vendor neutral data collection, but could add significant work during the migration.
- Check which all integrations are you using in Datadog, and whether all of those are supported. OpenTelemetry receivers may go a long way to cover various integrations.
In both the ingestion paths, a thing to watch out for is the metric names and labels attached to them. Data Enrichment - The Hidden Complexity goes in more detail about this. Metric names are easier to deal with - during dashboard/monitor migration, you will need to translate from datadog-style metric names to new metric names. Labels are tricky - Datadog on the server side adds additional labels to metrics ingested from datadog agent / integrations. You would need to check for what labels are you using in dashboard filters, metric filters, and monitor queries, and plan out a migration path.
Oodle takes an opinionated migration path to continue using Datadog agent for telemetry collection to reduce migration effort.
Query Translations: Traps to avoid
To translate Datadog queries to the new system, you or your agents need to check a number of things:
- Existing metric types in Datadog - delta counters, distribution metrics need special care. For example, prometheus doesn't have delta counters, so if you are ingesting into prometheus, you need to have delta to cumulative translation in the pipeline which is memory intensive as number of timeseries increase. For distribution metrics, native histograms in prometheus and exponential histograms in OTel are equivalent metric types.
- A similar Datadog query needs to be translated to different promql query based on the metric type. Below are few examples:
sum:queue.depth{*} by {service}->sum(queue_depth) by (service)for a gauge metric in Datadog.sum:orders.processed{*} by {service}->sum(rate(orders_processed[5m])) by (service)for a rate metric in Datadog.sum:checkout.requests{*} by {service}->sum(increase(checkout_requests[5m])) by (service)for a count metric in Datadog.
- Datadog normalizes metric tags to lowercase during ingestion, thus, filters with lowercase tag values need a case-insensitive comparison. E.g.
sum:checkout.requests{env:prod} by {service}.as_count()can match series whereenv: Prodorenv: prod, but if it is literally translated to promql assum(increase(checkout_requests{env="prod"}[5m])) by (service), it would not matchenv: Prodseries. Useenv=~"(?i)prod"to do a case-insensitive comparison.
Above are some common examples of traps to avoid while doing the query translations. The way Datadog does rollups in dashboards also affects visual verification as often the shape of the charts gets affected based on rollup intervals: The Rollup Problem goes in more details about it.
APM: Hard to find an out-of-the-box replacement
Datadog's out-of-the-box APM features are great for a developer. You install datadog agent, datadog sdk and it gives a service level view of golden signals, traces, endpoint level latency, error tracking out-of-the-box. To get this level of visibility, multiple components are working in tandem:
- Datadog agent sending metrics and traces, along with aggregated information about service spans.
- Datadog server showing relevant visualizations in a workflow suitable for easier human consumption.
OTel's spanmetricsconnector generates RED (Rate, Error, Duration) metrics from trace spans, but doesn't come closer to rich stats emitted by Datadog agent.
Datadog-like APM experience in Oodle
How does Oodle handle Datadog migration?
Oodle takes an opinionated approach to Datadog migration to reduce migration effort from months to days:
- Ingest data from datadog agents. This choice makes ingestion seamless by making it a configuration change, rather than changing SDKs, collectors across the codebase.
- Out-of-the-box APM experience. Due to ingesting same data which datadog agent sends, we provide similar out-of-the-box APM experience.
- Auto-migration of Dashboards and monitors. Our migration tooling allows you to select dashboards and monitors you would want to port over, which gets auto-translated. The translated queries are promql, so you remove vendor lock-in at one end during the migration.
This approach allows us to migrate large datadog environments within days instead of months. Check your datadog detox score: https://www.oodle.ai/datadog-detox-week
Datadog migration to Oodle