
How Lookout broke free from 8 years of lock-in to AI-Native Observability in 6 weeks


After 8 years on a leading observability platform, Lookout's observability bill was growing faster than the value they got from it. Here's how they migrated several thousand nodes, 300+ dashboards, and 2,000 alerts to Oodle in 6 weeks, without the usual migration horror story.
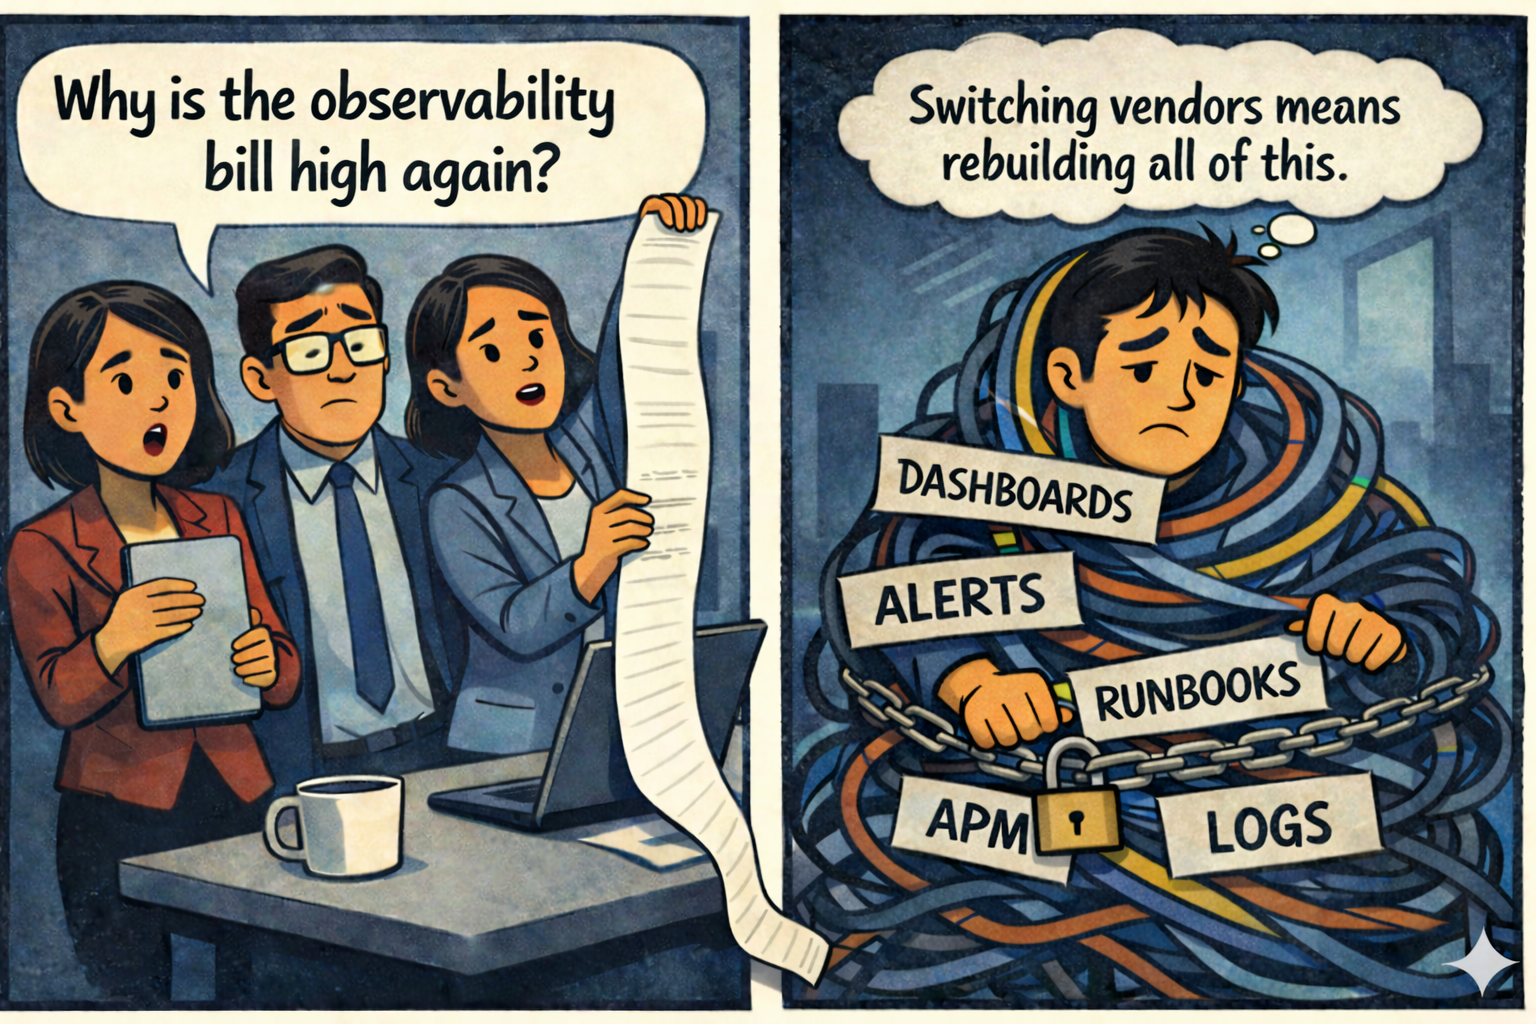
- Your observability bill makes finance ask questions every quarter
- You've built years of workflows around a tool and feel locked in
- You've been asked to "evaluate alternatives" but don't know where to start
- You've tried migrating observability platforms before and got burned
- You want to understand the real effort involved
If any of these sound familiar, this migration story is for you.
Lookout is a cybersecurity company protecting over 2,000 enterprises and 230M mobile devices worldwide. They run infrastructure across AWS and GCP with several thousand nodes. Here's how they moved off an expensive observability contract and migrated to Oodle in 6 weeks.
Why Lookout Considered Switching
Great Discounts, Still a Big Bill
Lookout had been on a leading observability platform for 8 years. The platform was excellent, and the team had no complaints about the product itself.
We'd been on our observability platform for many years with a sizable contract for several thousand nodes. We had amazing pricing compared to market benchmarks, a rate we managed to negotiate year after year, but it was still extremely expensive.
Francisco J. Reyes
Senior Director, Lookout
Sound familiar? Many long-term customers of leading platforms face this exact tension. You can have great discounts compared to new customers and still pay a bill that's hard to justify.
The Accumulated Complexity Problem
Eight years of usage creates more than dashboards and alerts. It builds up complexity: platform-specific tooling, architecture to manage costs, configurations nobody fully understands anymore.
The fact that we had the contract for so long meant that we had a lot of unnecessary stuff in there that had accumulated over the years.
Francisco J. Reyes
Senior Director, Lookout
The Lock-in Reality
From a contractual perspective, we were kinda locked in a situation where we were spending a lot more than we wanted.
Francisco J. Reyes
Senior Director, Lookout
Here's the most frustrating part. Traditional cost optimization wasn't an option. When you're already at the floor of your negotiated pricing, the only paths forward are: accept the cost, reduce visibility, or find an alternative.
Lookout chose to explore alternatives.
What Lookout Was Looking For
The team wasn't just looking for "cheaper." Before spending time on a PoC, they needed confidence in three areas: cost, effort, and long-term platform direction.
Predictable Economics
Every vendor claims to be cheaper. That's table stakes. Lookout needed to verify the details:
What they asked:
- What's your pricing model? Per host? Per GB? Per unique time series?
- How do you price custom metrics? (This is where costs tend to explode.)
- What happens at renewal? Will you lock in rates?
- Can you handle our full production volume during the PoC without data caps?
What they watched out for:
- Vendors cheapest for only one signal (logs, metrics, or traces)
- First-contract discounts that spike at renewal
- Data caps during PoC that prevent real validation
- Whether the quoted cost includes infrastructure, or only subscription fees, especially for BYOC platforms where compute is billed separately
What they found with Oodle:
- Transparent pricing with no hidden multipliers
- No separate pricing for infrastructure metrics vs. custom metrics (a major cost driver in their previous platform)
- No user-based pricing
- No separate ingestion vs. query charges
- No additional costs for alerts
- No PoC data limits; the recommendation was to send full production workload
The result is pricing that scales with your infrastructure, not against it.
Low Migration Risk
This is where most migrations fail before they start. Lookout needed clear answers:
Code changes:
- Do we need to modify application code?
- Do we need to change how metrics, logs, or traces are emitted?
Infrastructure changes:
- Do we need to deploy new collectors (e.g., OpenTelemetry)?
- What compute resources will this require?
Migration ownership:
- Who migrates dashboards and alerts: vendor or customer?
- Who handles the edge cases?
What Lookout experienced:
- Zero code changes: Data ingested directly from existing agents
- Minimal config changes: Under 10 lines added to agent config for dual-shipping
- Vendor-owned migration: Oodle migrated all dashboards and alerts; Lookout focused on verification
- Direct engineering support: You work with Oodle engineers, not a customer success relay
Most alternative vendors require forwarding data through an OpenTelemetry Collector, adding compute costs and complexity before you've even started evaluating.
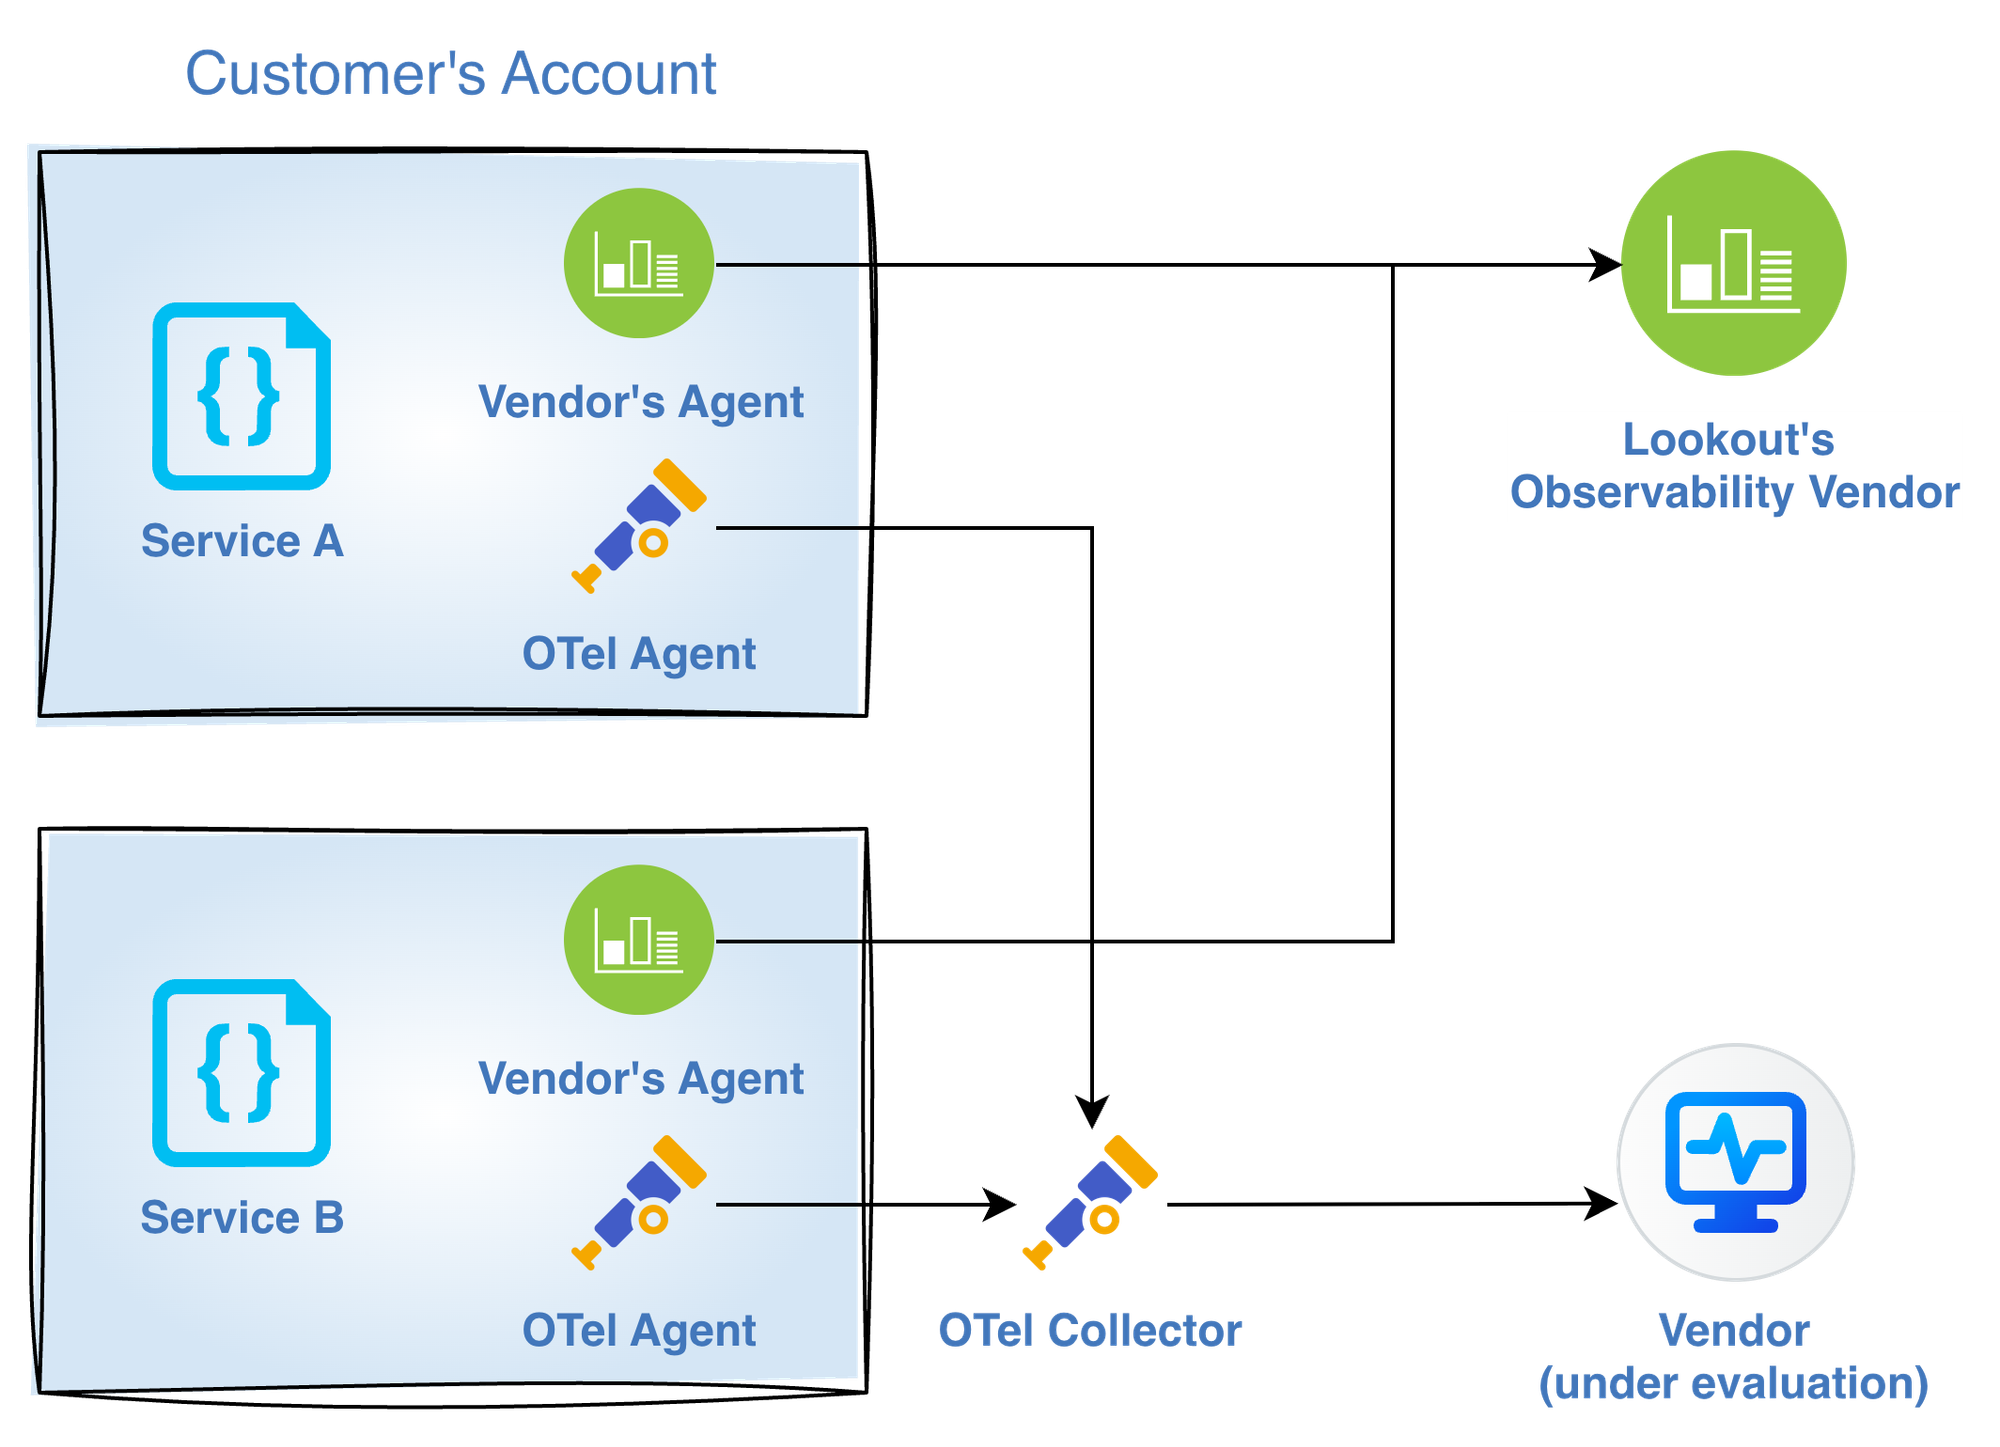
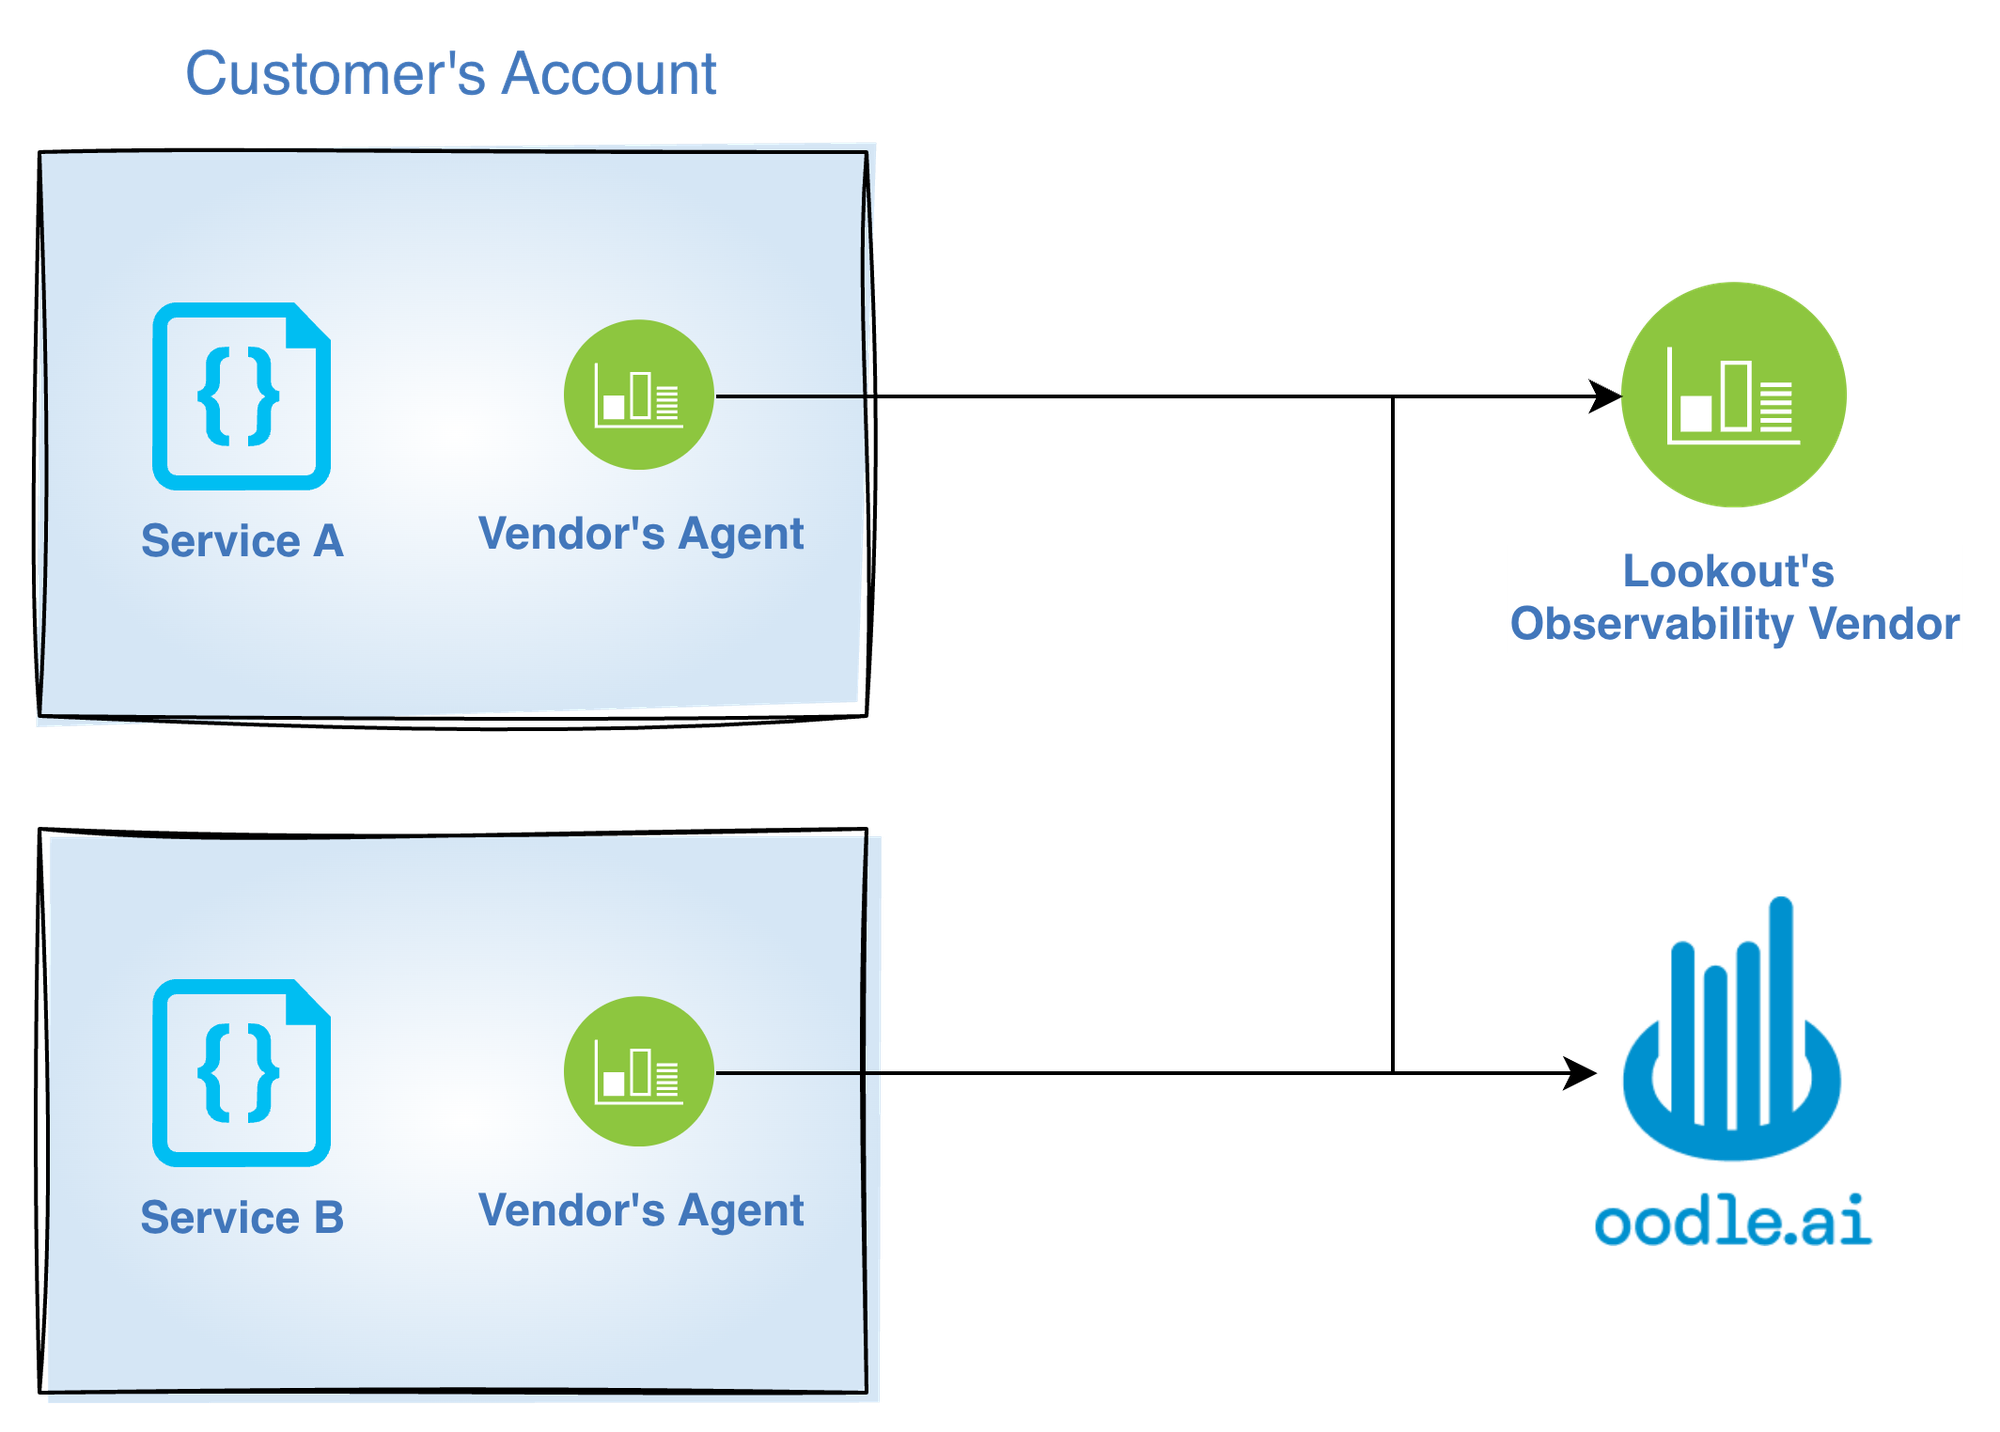
Being able to leverage our existing agents was a nice surprise. Without this, the migration of this magnitude would have taken a lot longer.
Beatrice Gelman
Senior Manager, Lookout
A Modern AI-Native Platform
Beyond cost and risk, Lookout wanted a platform built for the next few years, one that supports their plans to expand AI usage across observability workflows.
Oodle's AI lets teams ask questions in plain English instead of writing queries. It helps validate hypotheses during incidents and is available across the UI, Slack, and developer tools like Cursor and Claude Code. For Lookout, it was a signal that the platform was heading in the same direction as their engineering org.
I LOVE the AI assistant feature. It saves me a ton of time modifying graphs, creating alerts, and more.
Senior Staff Software Engineer, Lookout
The PoC Journey
A good PoC does more than check boxes. It builds enough confidence that your teams trust the data and can work in the new system day to day. Lookout focused on three areas during their ~3-week PoC.
Setting Up Data Ingestion
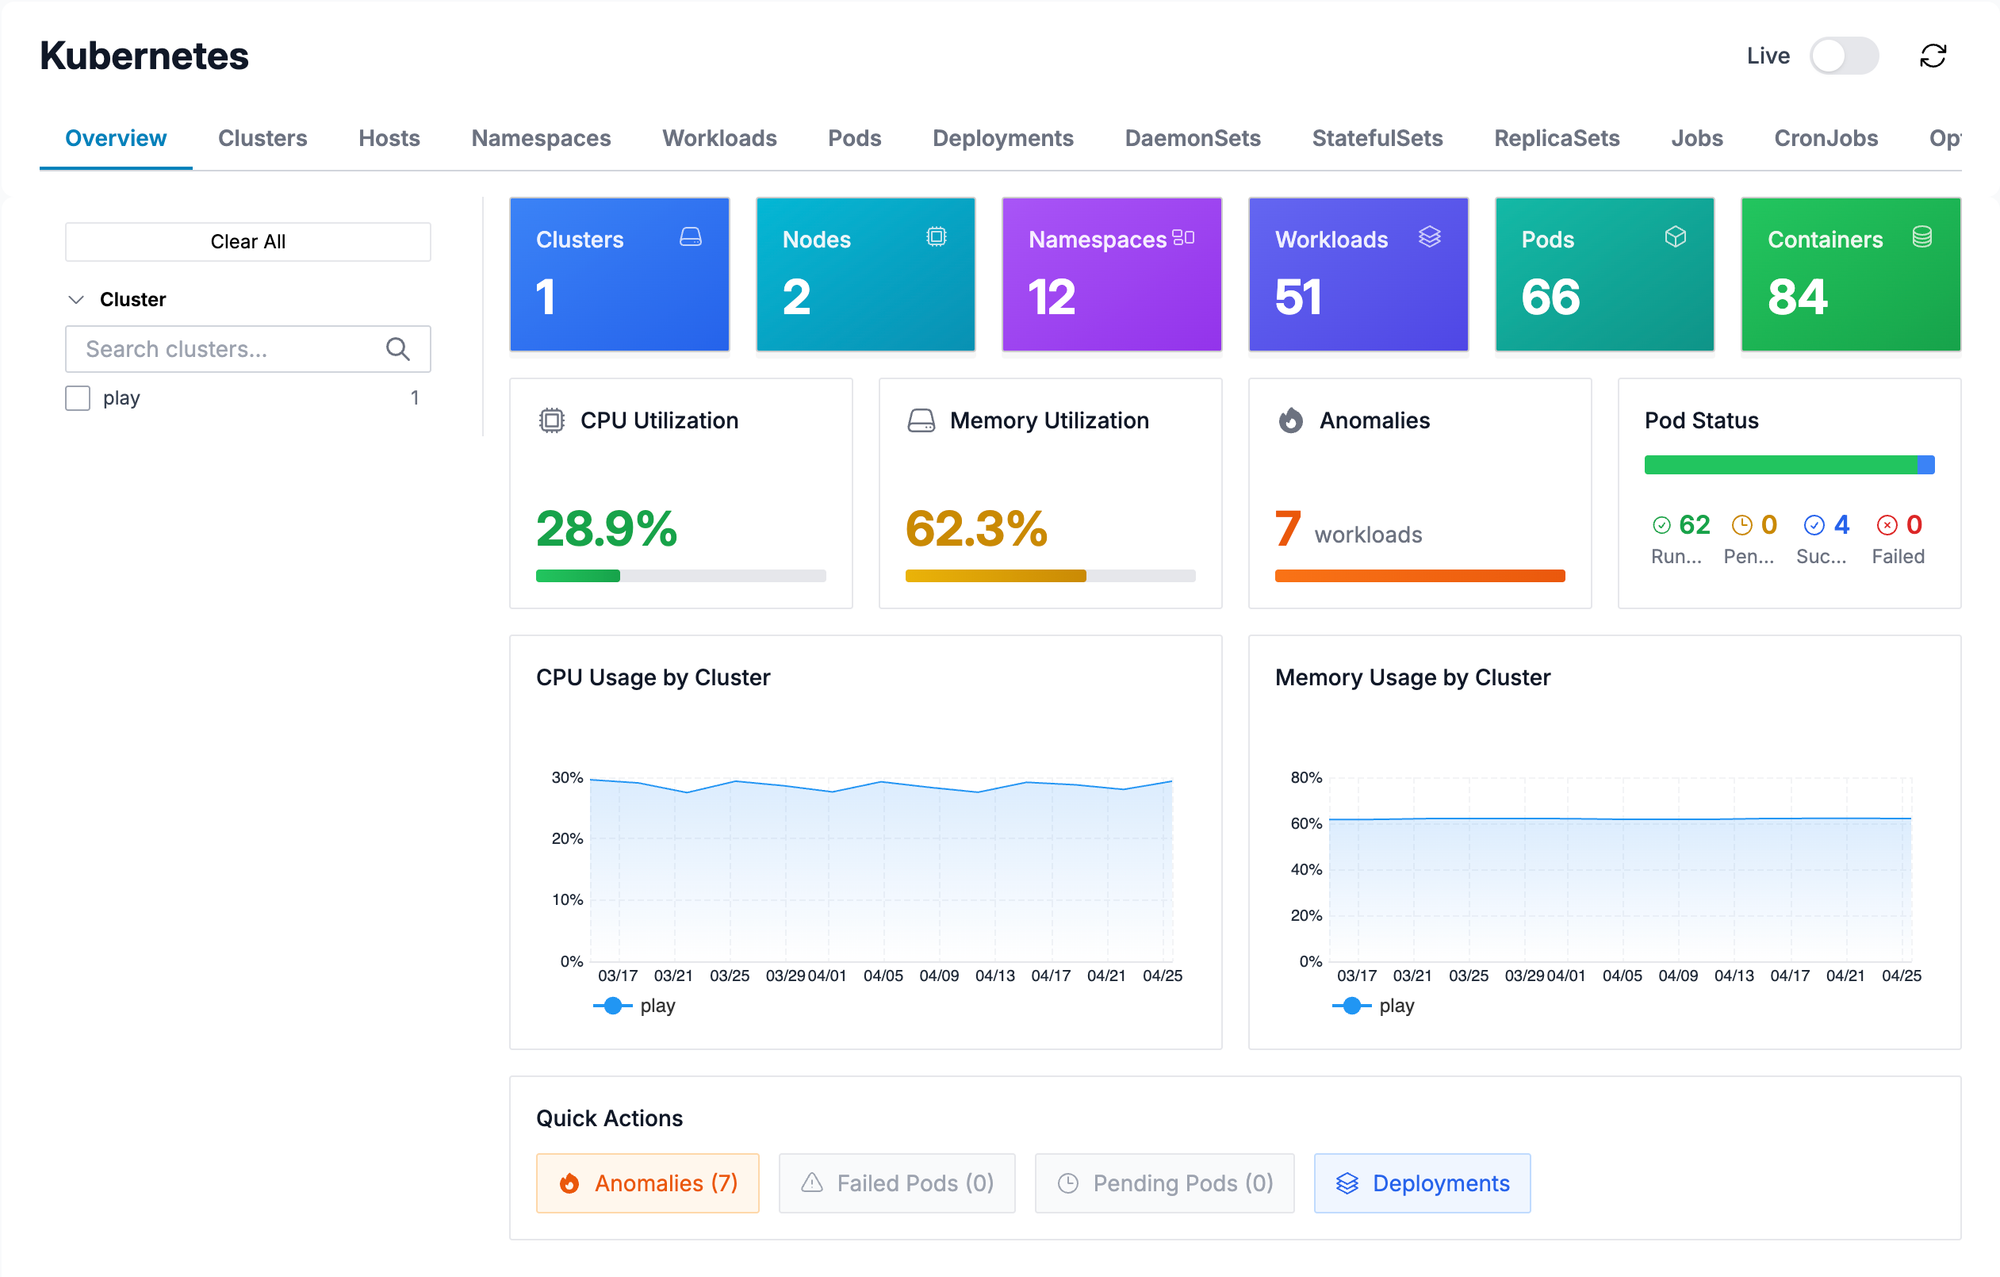
Lookout runs services across GCP and AWS. They needed to confirm that all telemetry signals from both clouds ingested correctly, that Oodle's out-of-the-box dashboards matched their existing platform's, and that metrics were automatically tagged with cloud resource tags.
Data Enrichment: The Hidden Complexity
For Lookout's team to trust the new platform, the numbers had to match. And numbers only match when enrichment works the same way as their previous platform.
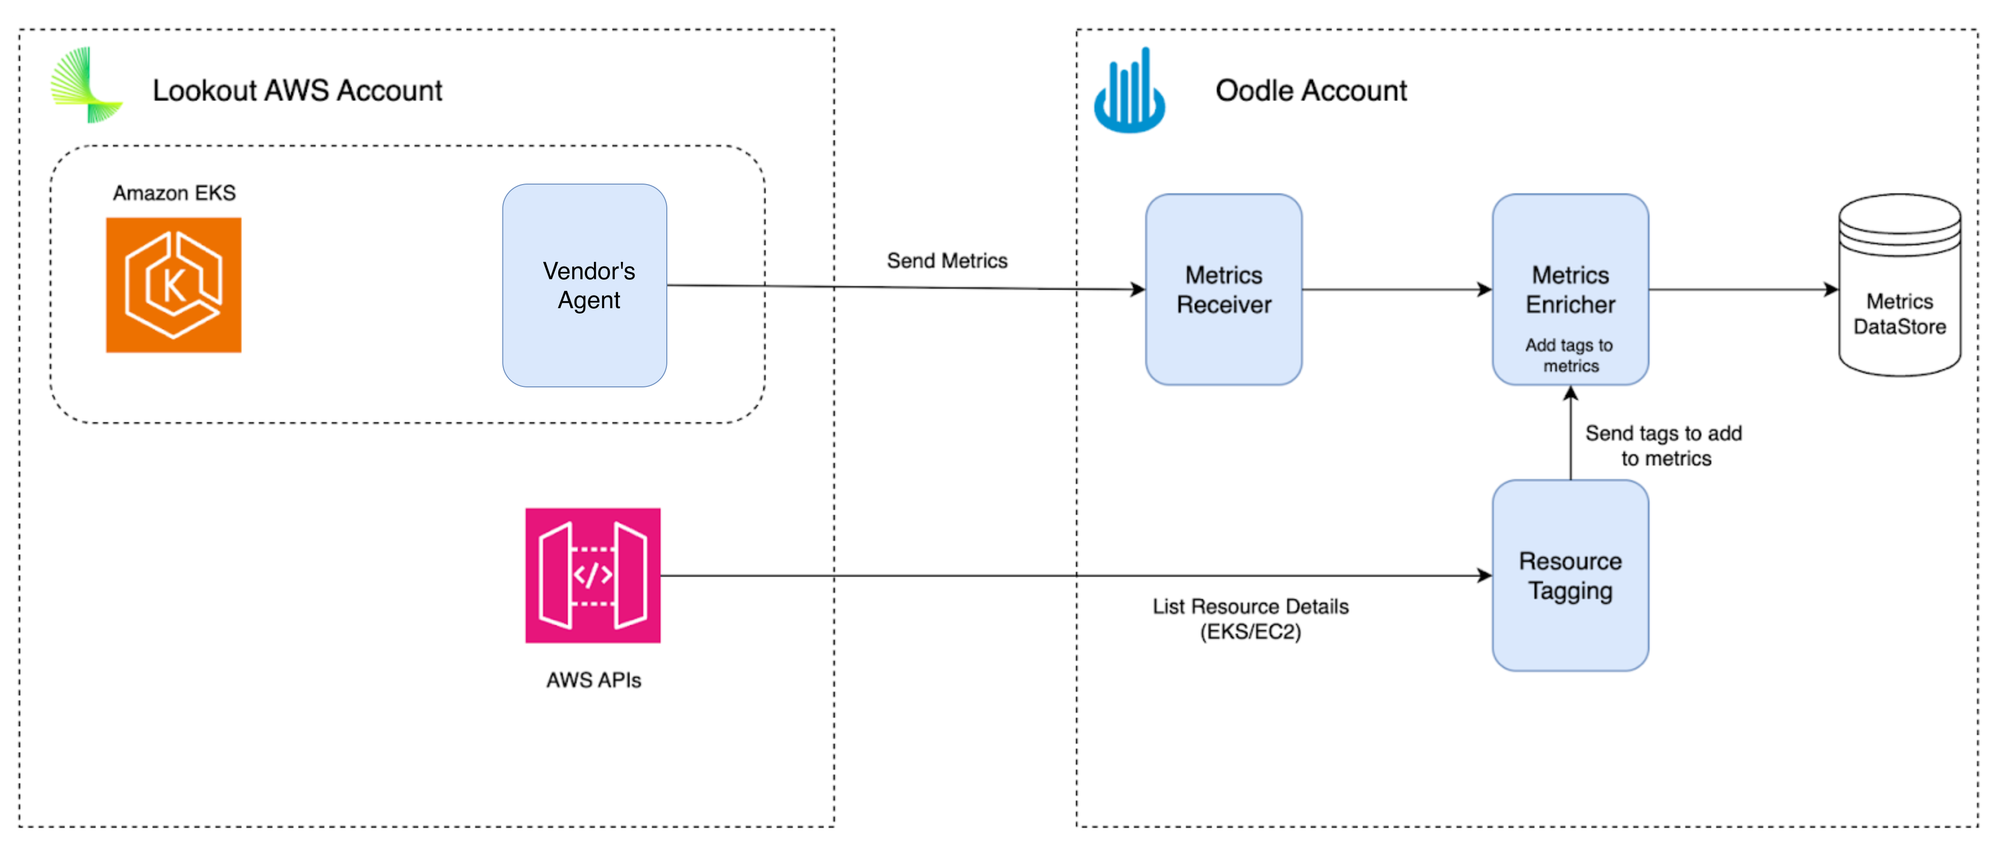
Lookout's previous platform automatically attaches infrastructure tags to every metric. Emit api.latency from a host tagged env:production, and you can filter by environment without ever adding that tag yourself. Lookout's dashboards and alerts were built on top of that automatic enrichment, so any alternative had to replicate it exactly, or everything downstream would break.
This turned out to be a key differentiator during evaluation. Oodle replicated the enrichment model fully: no custom labels or tags needed. The team validated that infrastructure metrics, custom metrics, and cloud provider metrics (EC2 tags, GCP labels) all carried the right tags automatically.
Visualization Validation
If you already know Grafana and OpenSearch, you'll feel right at home. If not, here's the honest truth: Lookout's previous platform had genuinely good visualizations. Expect some differences as you adjust to the Grafana and OpenSearch UX. That said, Oodle has made custom modifications to both to bring over features that customers care about, so you're not losing the good stuff, just getting it in a different wrapper.
Lookout's approach was pragmatic. Instead of demanding pixel-perfect widget matching, they asked: "What's the equivalent visualization that gives us the same insight?"
Challenges in Observability Migrations
During the PoC and migration, Lookout ran into a few challenges that come up in any large-scale observability migration. How these got resolved shaped their confidence in the move.
The Rollup Problem
This one is subtle but it trips up almost every migration. When you view a chart, the platform can't plot every raw data point. It aggregates them into time buckets, and the bucket size changes based on chart type and time range. If the rollup interval doesn't match what your team is used to, identical data produces different numbers on screen.
Here's a real example. Both charts below show the same metric (kubernetes_pods_running summed by host) over the same 6-hour time range in Oodle. Look at 17:40:
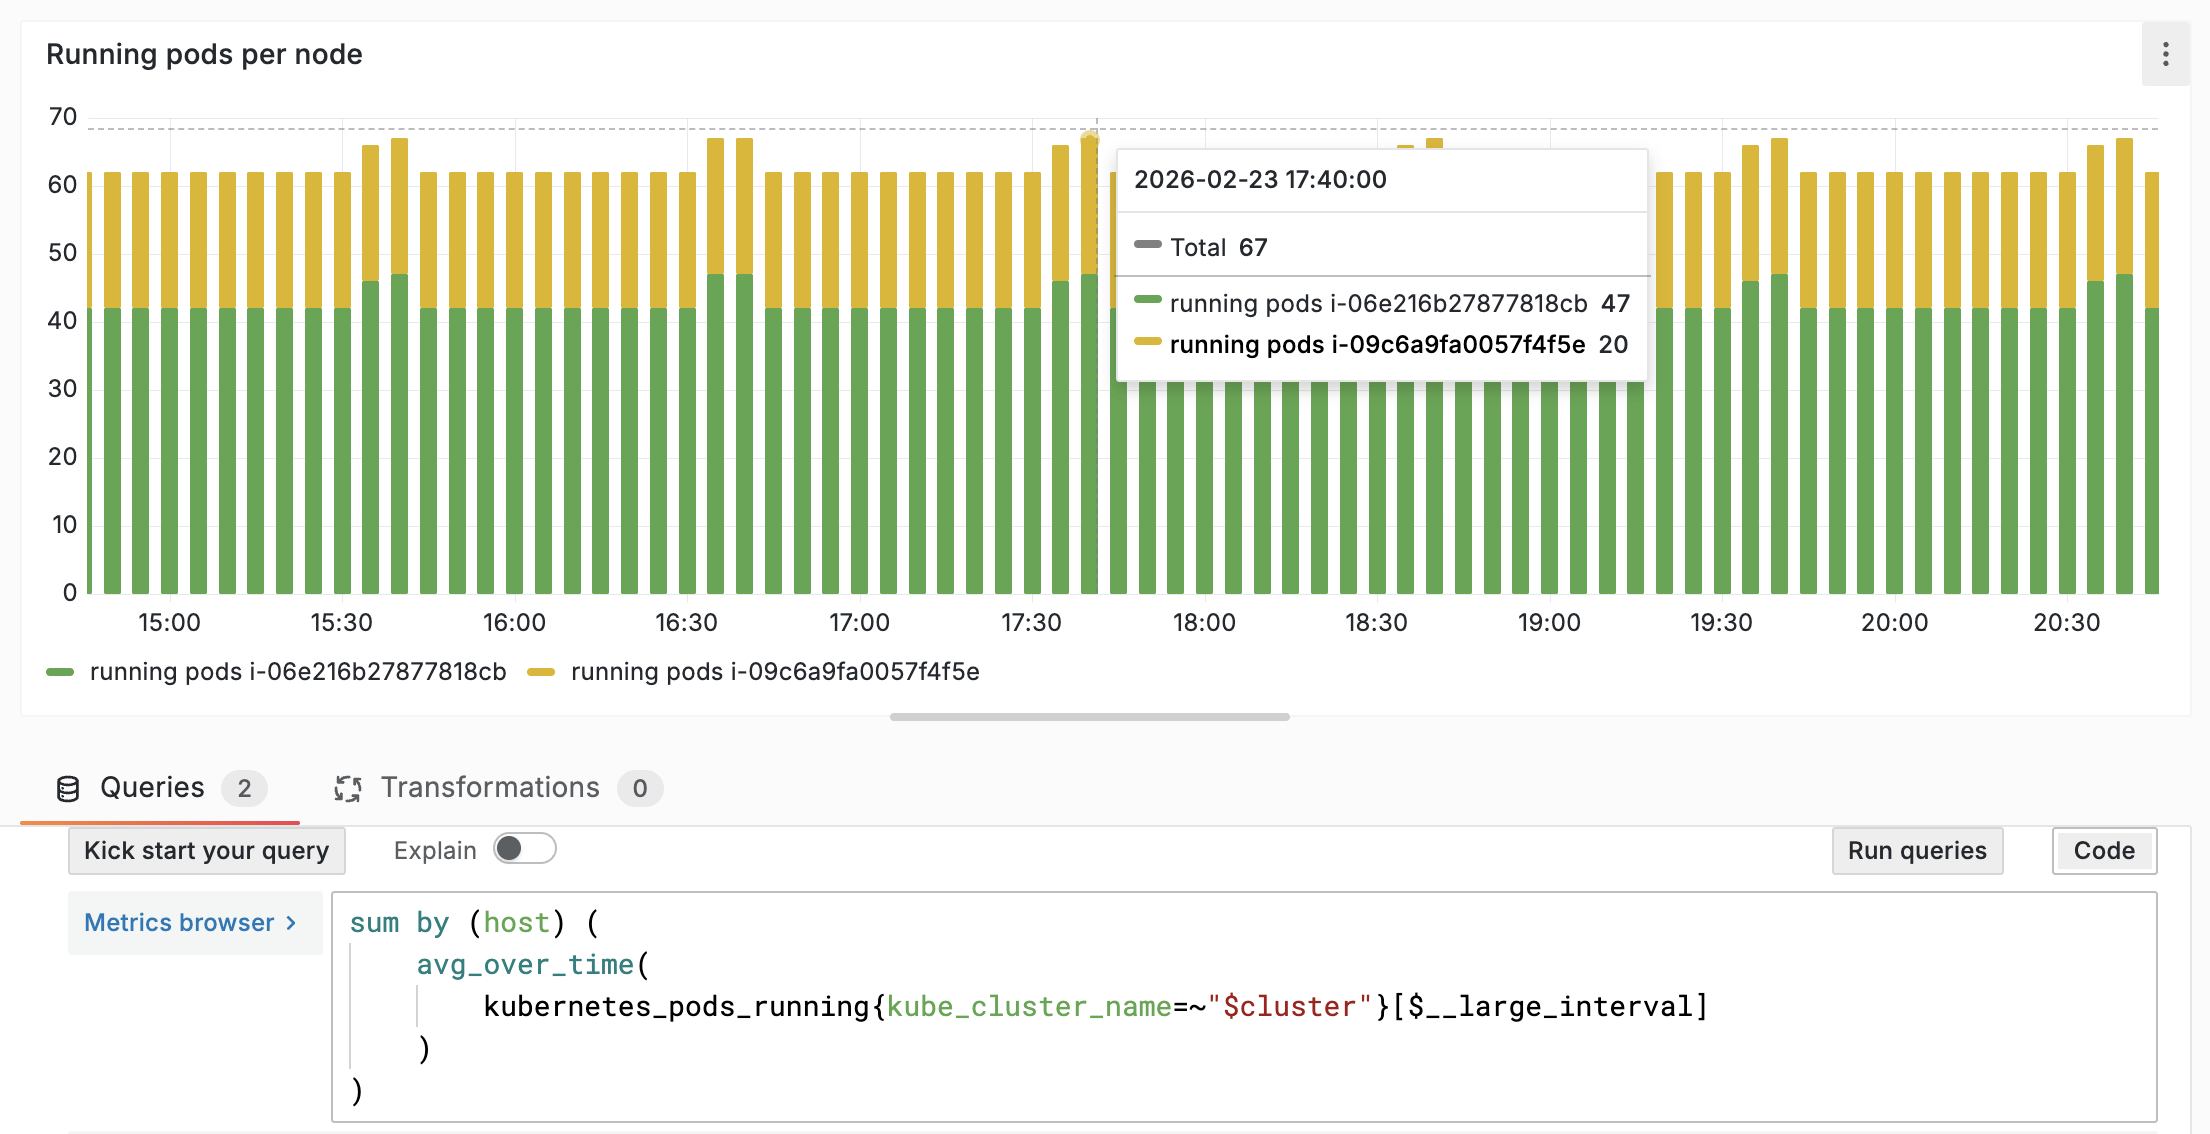
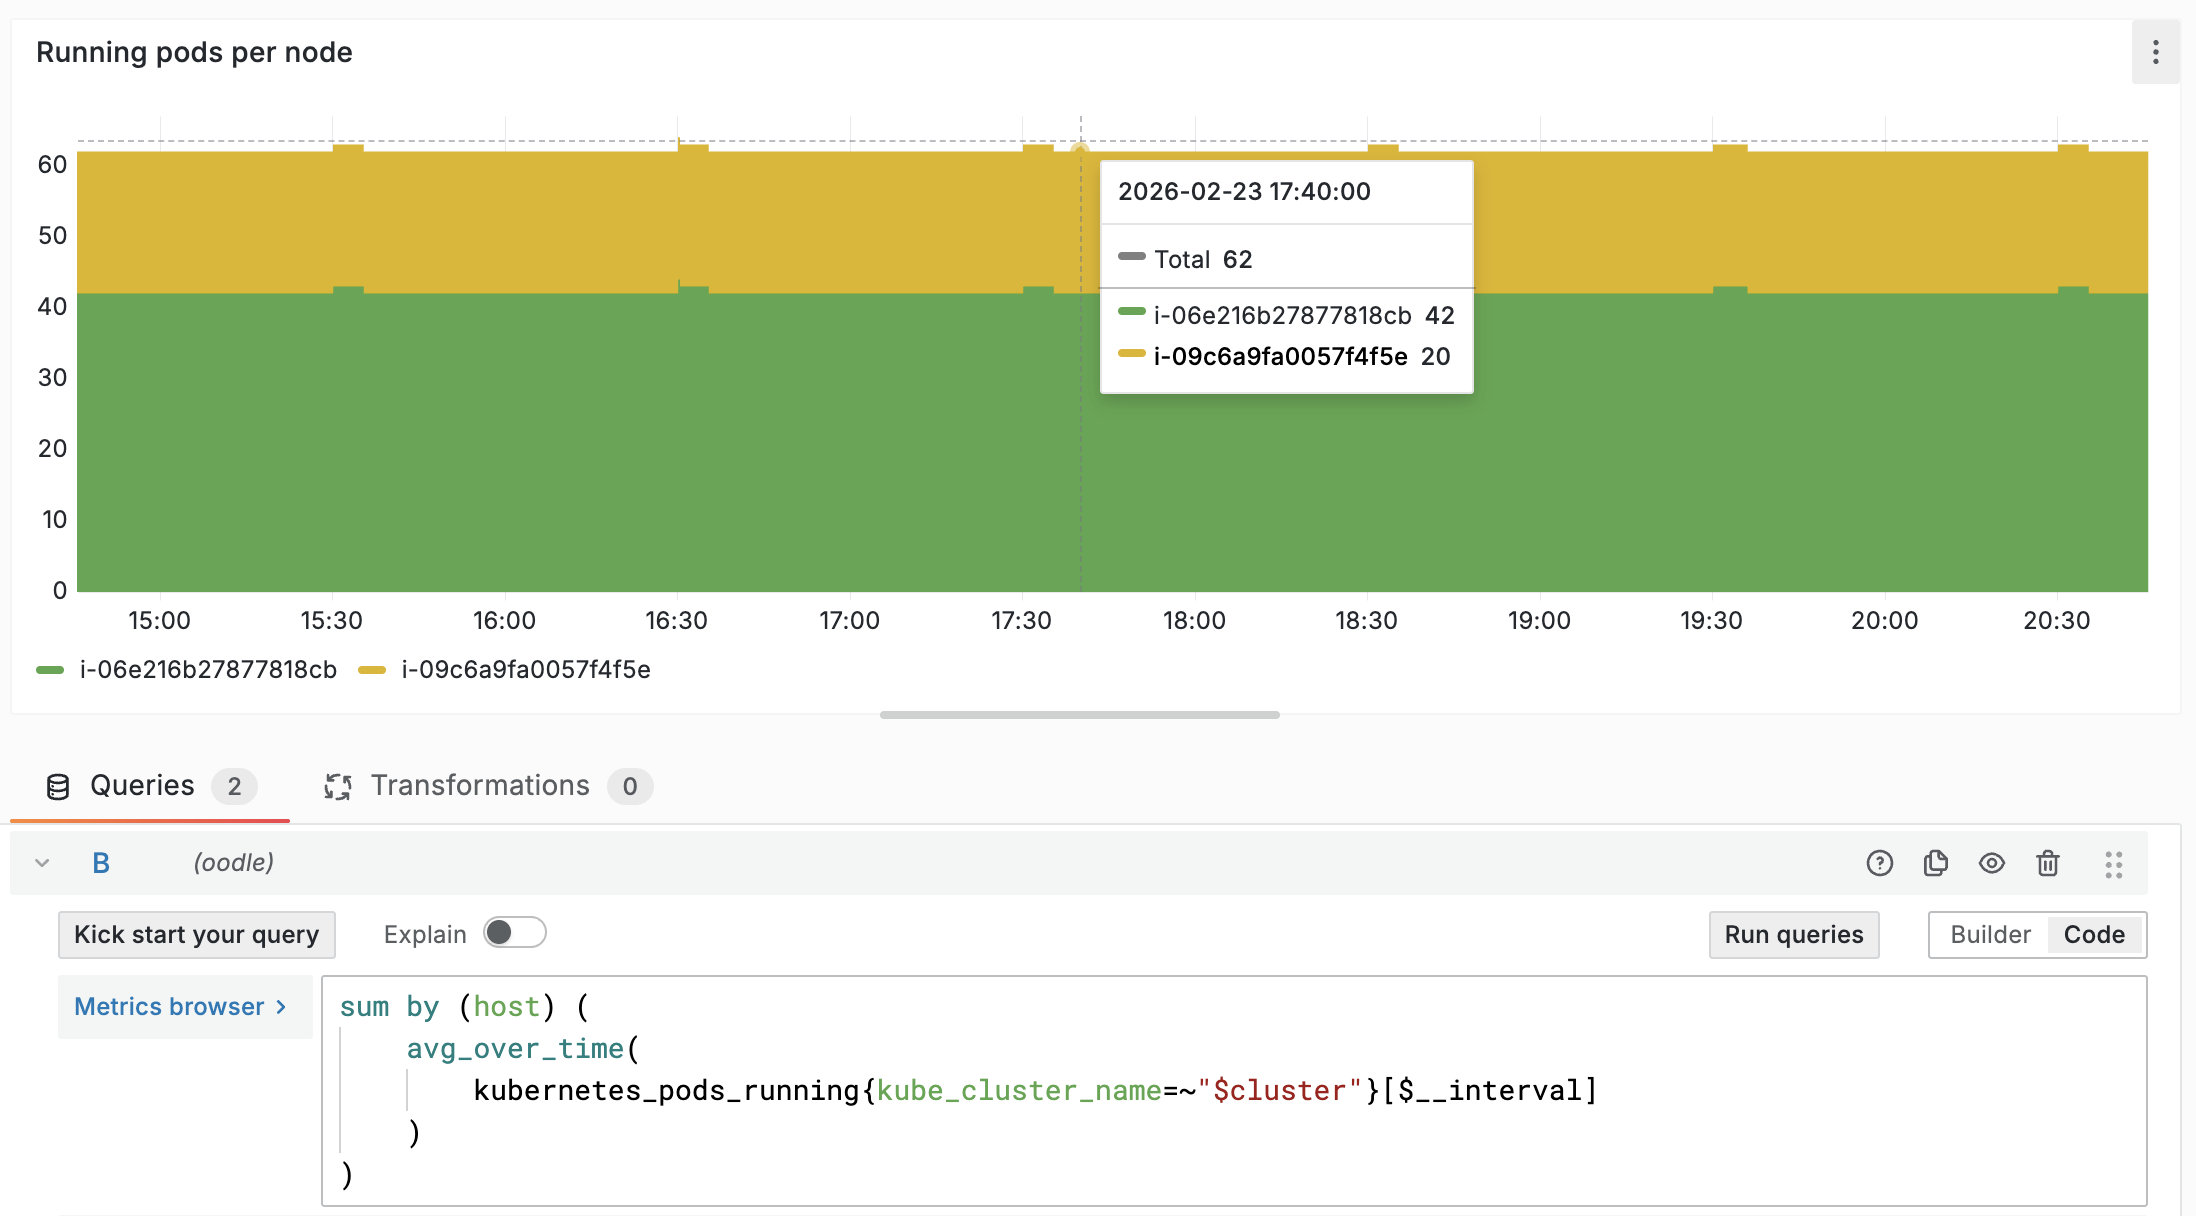
Same data. Same query. Same time range. Chart A uses Oodle's custom $__large_interval variable (5-minute rollup) and shows 67 pods. Chart B uses Grafana's default $__interval variable (20-second rollup) and shows 62. A difference of 5 pods from nothing more than a rollup interval change. Multiply that across hundreds of dashboards and you see why teams lose confidence, even when nothing is actually wrong with the data.
How Oodle solved this for Lookout: Oodle built custom interval variables in PromQL that match the rollup behavior Lookout's team was used to from their previous platform. With $__large_interval applied across migrated dashboards, the numbers matched what engineers expected. Not approximately, but exactly. That eliminated the confidence gap during validation.
Cloud Metric Ingestion
Lookout runs across both AWS and GCP, so cloud metric ingestion costs were a real concern. Their previous platform used a pull-based model with filters letting them ingest metrics only for specific environments (e.g., env: production) rather than everything. Oodle offered the same model and the same filtering capability, so Lookout kept their existing cost controls intact without any configuration changes.
Closing Integration Gaps
Oodle has a large list of integrations, but it doesn't cover everything every platform offers. That's the honest trade-off. What matters is how fast gaps get closed when an integration matters to your workflows.
For Lookout, AWS Cloudwatch integration with tag based filtering and built-in kubernetes experience were both critical. Neither existed in Oodle at the start of the evaluation. Oodle built pull based AWS metrics integration during the PoC, that matched the team's previous experience. The kubernetes experience that they were used to followed shortly after.
The engineering team was impressed by the turnaround. You're working with a vendor that doesn't have everything out of the box, but one that moves fast to fill the gaps that matter to you.
Production Migration: A 6-Week Collaborative Journey
We achieved full migration in six weeks at our size. I'm thrilled by how much we could accomplish in such a short time.
Beatrice Gelman
Senior Manager, Lookout
After a successful PoC, Lookout moved to full migration. The migration unfolded over six weeks of coordinated effort across platform, observability, and service teams. Rather than flipping a switch, it was a structured program with clear phases and shared ownership.
Scale
- Several thousand nodes to migrate
- 300+ dashboards to translate
- 2,000 monitors/alerts to recreate
- Timeline: 6 weeks
How the Rollout Unfolded
- Dual write. Send data from all the nodes to both the existing platform and Oodle.
- Translation. Migrate dashboards and monitors at scale.
- Gap closure. Fix missing workflows and integration gaps.
- Cutover. Unmute alerts gradually. Validate on-call behavior. Deprecate dual shipping and send all the data only to Oodle.
Who Owned What
Dashboard Migration
Lookout had 300+ dashboards, each built over years with team-specific patterns. Oodle's migration tooling translated them with 95-99% accuracy, a figure that's possible in large part because Oodle ingests from existing agents directly. Metric names carry over with a predictable naming convention, so the translation is deterministic. Vendors that require a different agent or collector layer face a harder problem: metric names and structures can shift during collection, turning dashboard migration into query translation and metric remapping at the same time.
The remaining 1-5%? Edge cases from widget types that don't have direct Grafana equivalents, or query patterns the automation hadn't seen before. Those went through AI-assisted cleanup and QA. The combination of automation, AI, and human review is what made the timeline possible at Lookout's scale.
Alert Migration
Alerts are where migrations tend to hurt the most. With over 2,000 alerts to move, Lookout had to be sure that every critical use case would carry over. Here's what gets translated and what Oodle supports.
Alert structure:
- Query: Translated to PromQL
- Conditions: Mapped to critical/warning thresholds
- Message templates: Parsed and converted from the previous vendor's custom variable language
- Notification routing: Mapped to Oodle notifiers
Resource Requirements
What does a 6-week migration actually cost in people-hours?
From Oodle:
- Dedicated engineers with deep knowledge of the previous platform's internals
- Direct Slack channel (no customer success middleman)
- Continuous iteration on migration tooling based on your feedback
- Ownership of all dashboard/alert translation and QA
From the customer:
- Three engineers for coordination, config changes, and feedback
- One representative from each team to verify their own dashboards and alerts
- Final sign-off on migrated assets
What Made the Difference
The most important factor wasn't technical. It was how the two teams worked together. Lookout worked directly through a dedicated Slack channel with Oodle engineers who understood the previous platform's internals, could make product changes during the migration, and responded to issues in real-time. No customer success relay. Beyond async communication, Oodle ran daily office hours during the migration where Lookout engineers could ask questions, share feedback, and get familiar with the product.
The turnaround speed on issues surprised the entire team. When engineers reported problems, Oodle applied fixes holistically across all affected dashboards and monitors rather than one at a time. That responsiveness and willingness to iterate built trust quickly across Lookout's engineering org.
It was a very collaborative experience. Anytime anything was uncovered, the Oodle team jumped on it to fix it. Some things were fixed immediately, some were already available and we just weren't finding them, and some had to be built. But it was a very good experience to have the full attention of the team to make things work.
Francisco J. Reyes
Senior Director, Lookout
8 Years on One Platform, 6 Weeks to Migrate
The question for most teams is not whether a move like this can be done. It is whether you want to keep absorbing the cost, or find a partner that fits where you are going and act on it.
Lookout proved that migrating after 8 years on an established observability platform is possible, even with several thousand nodes, thousands of alerts and hundreds of dashboards. And on the other side, they found more than just savings. They found a modern observability partner whose AI-native direction aligns with where their engineering org is heading.
We'd been on a leading observability platform and we never thought we could easily switch until Oodle proved otherwise. They migrated thousands of nodes, dashboards, and alerts in weeks. Performance improved, costs dropped.
Nagendra Swamy
VP, Lookout
For a broader architecture, pricing, and feature comparison, see Why Switch to Oodle. Access your savings using our pricing calculator or contact us to learn more about how Oodle can help you.