One Tool, One Workflow, Everyone on the Same Page - Bedrock Data's Observability Reset with Oodle

✨ TL;DR Bedrock Data secures petabytes of enterprise data across AWS, Azure, and GCP. Their observability was fragmented: a major log analytics vendor, CloudWatch, and custom scripts, each used by different people for different things.
Challenges:
– Three disconnected tools, no common workflow for troubleshooting
– No correlation between Lambda logs and metrics
– Query-heavy interfaces discouraged broad adoption
After moving to Oodle:
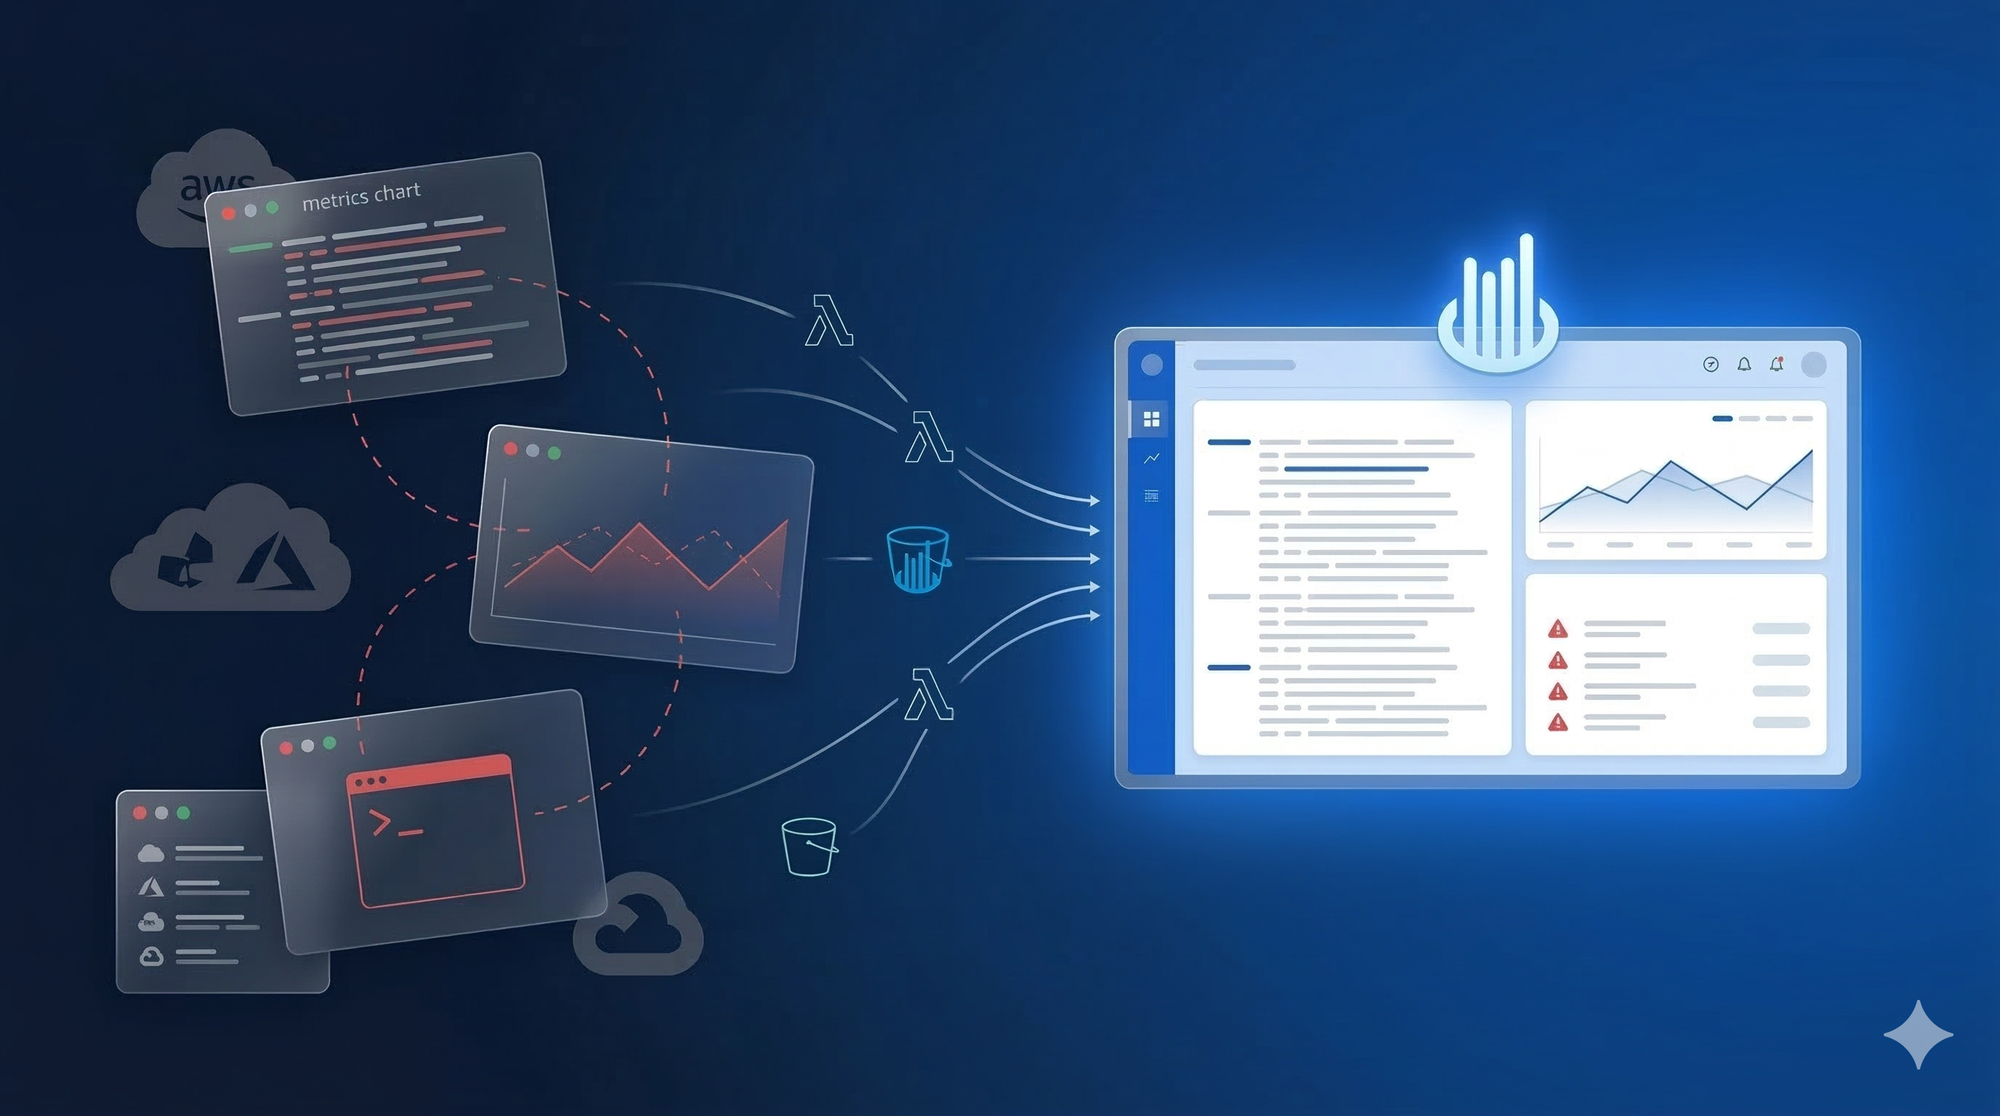
– One platform for logs, metrics, and alerts
– Automatic log-to-metric correlation for Lambda functions
– 50% reduction in incident resolution time
– End to End onboarding in under five hours
– Strongest tool adoption to date across all users
"Oodle is a fully baked, from-the-ground-up observability platform. An observability platform needs to look and feel as if it's all one integrated process. And that's what Oodle does."
– Olaf Stein, Head of Customer Success, Bedrock Data
Scanning Petabytes, Connecting the Dots
Half of your most critical telemetry comes from infrastructure you don't own. That's the reality when your product deploys thousands of Lambda workers directly into customer AWS, Azure, and GCP accounts, and you need to know what they're doing at 11 PM on a Tuesday.
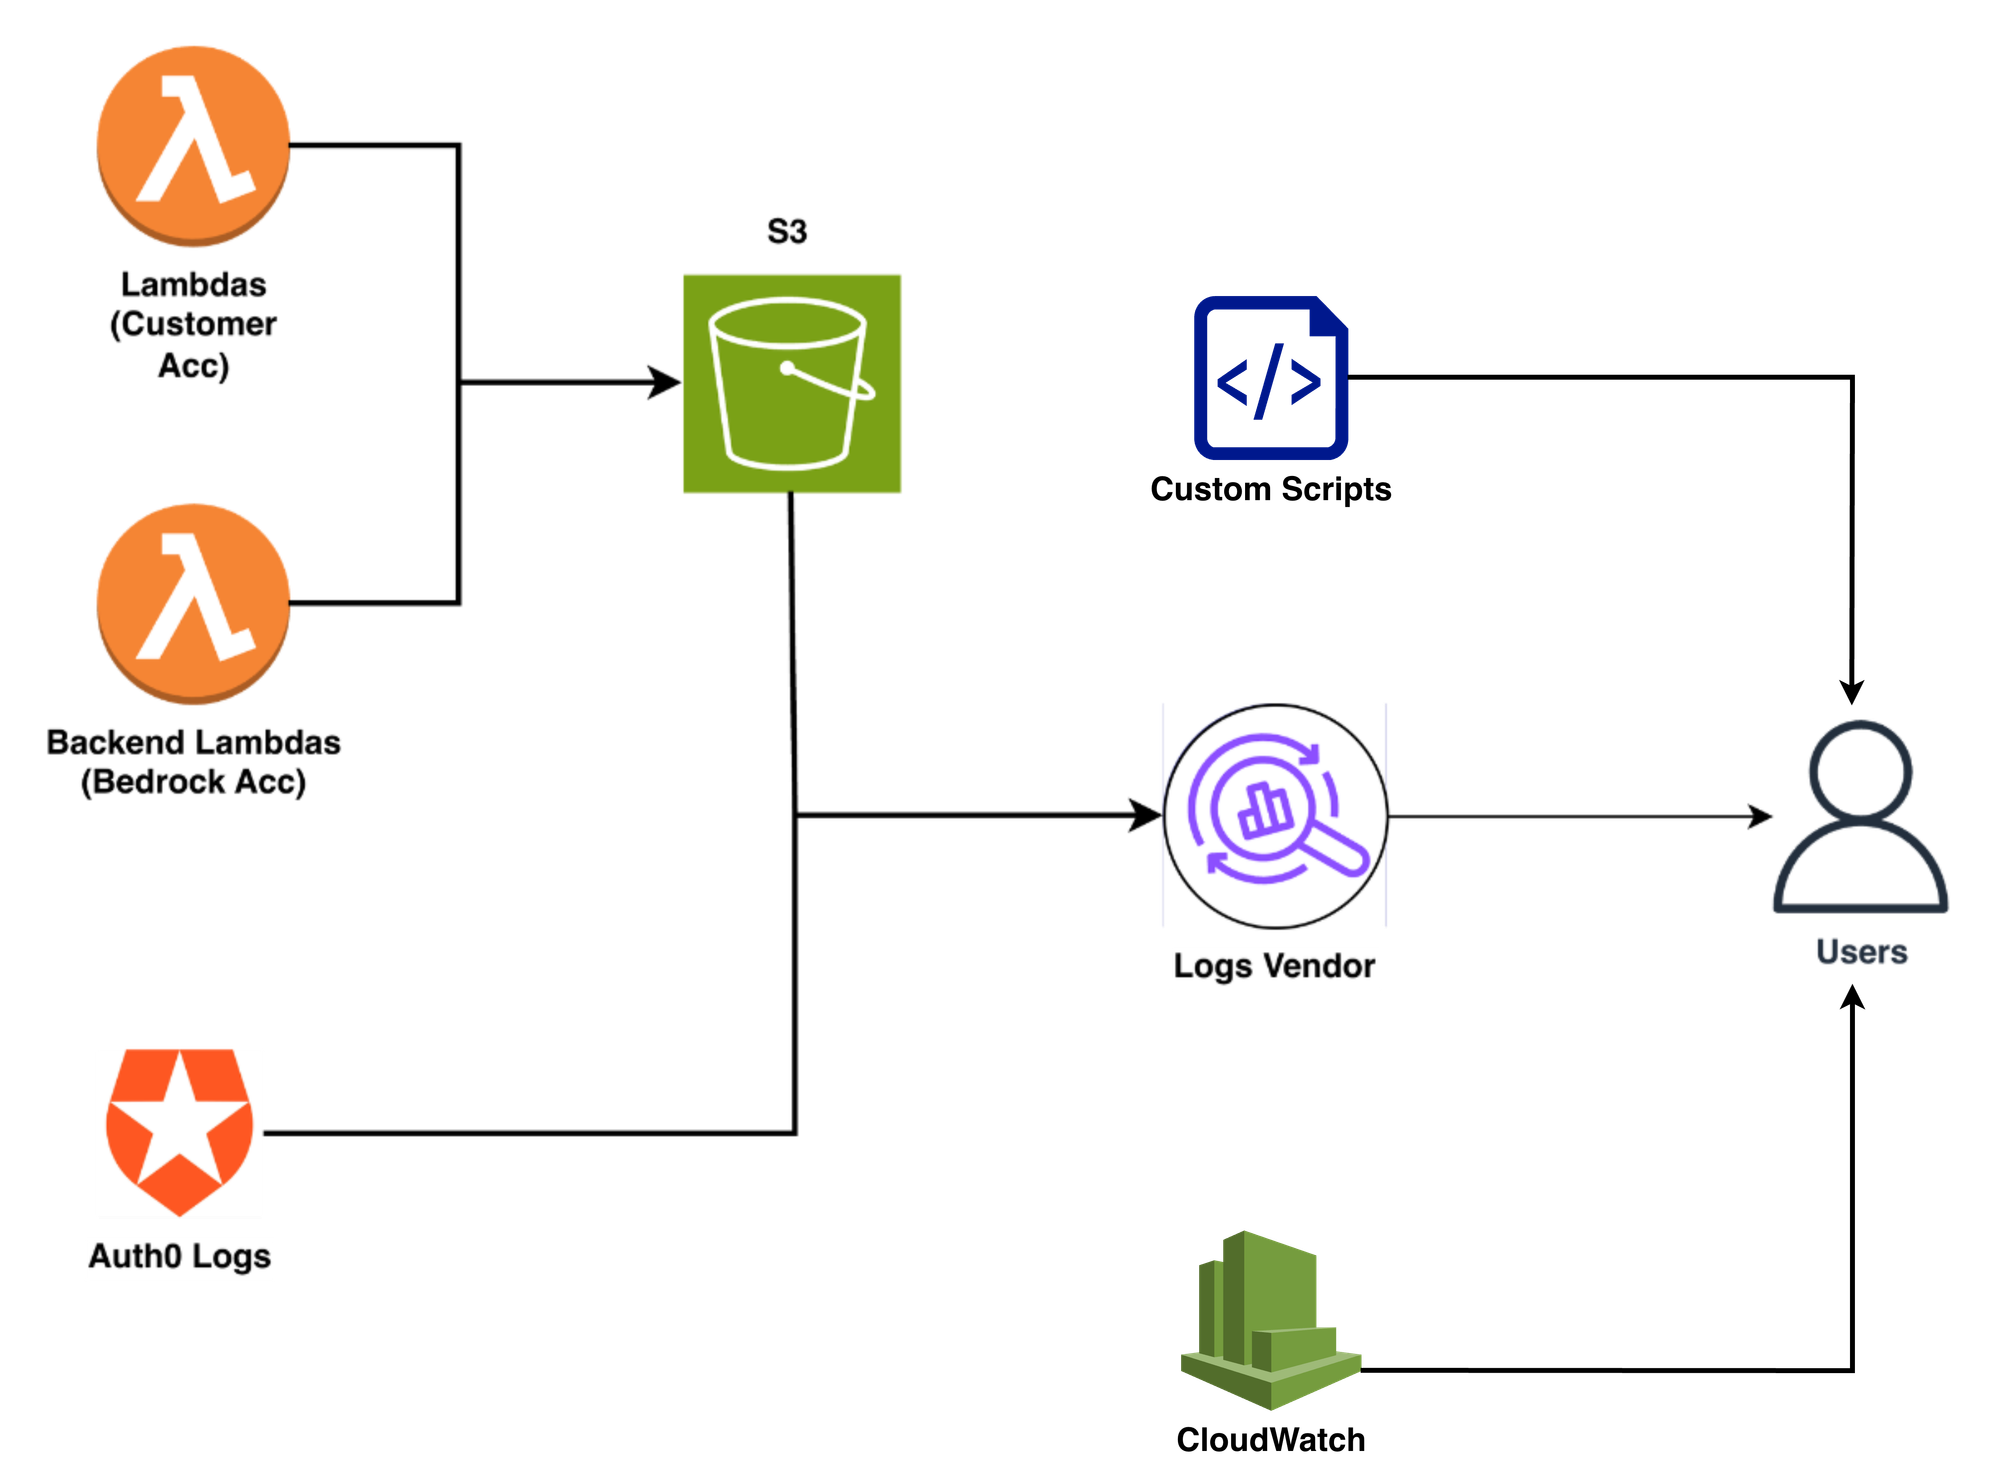
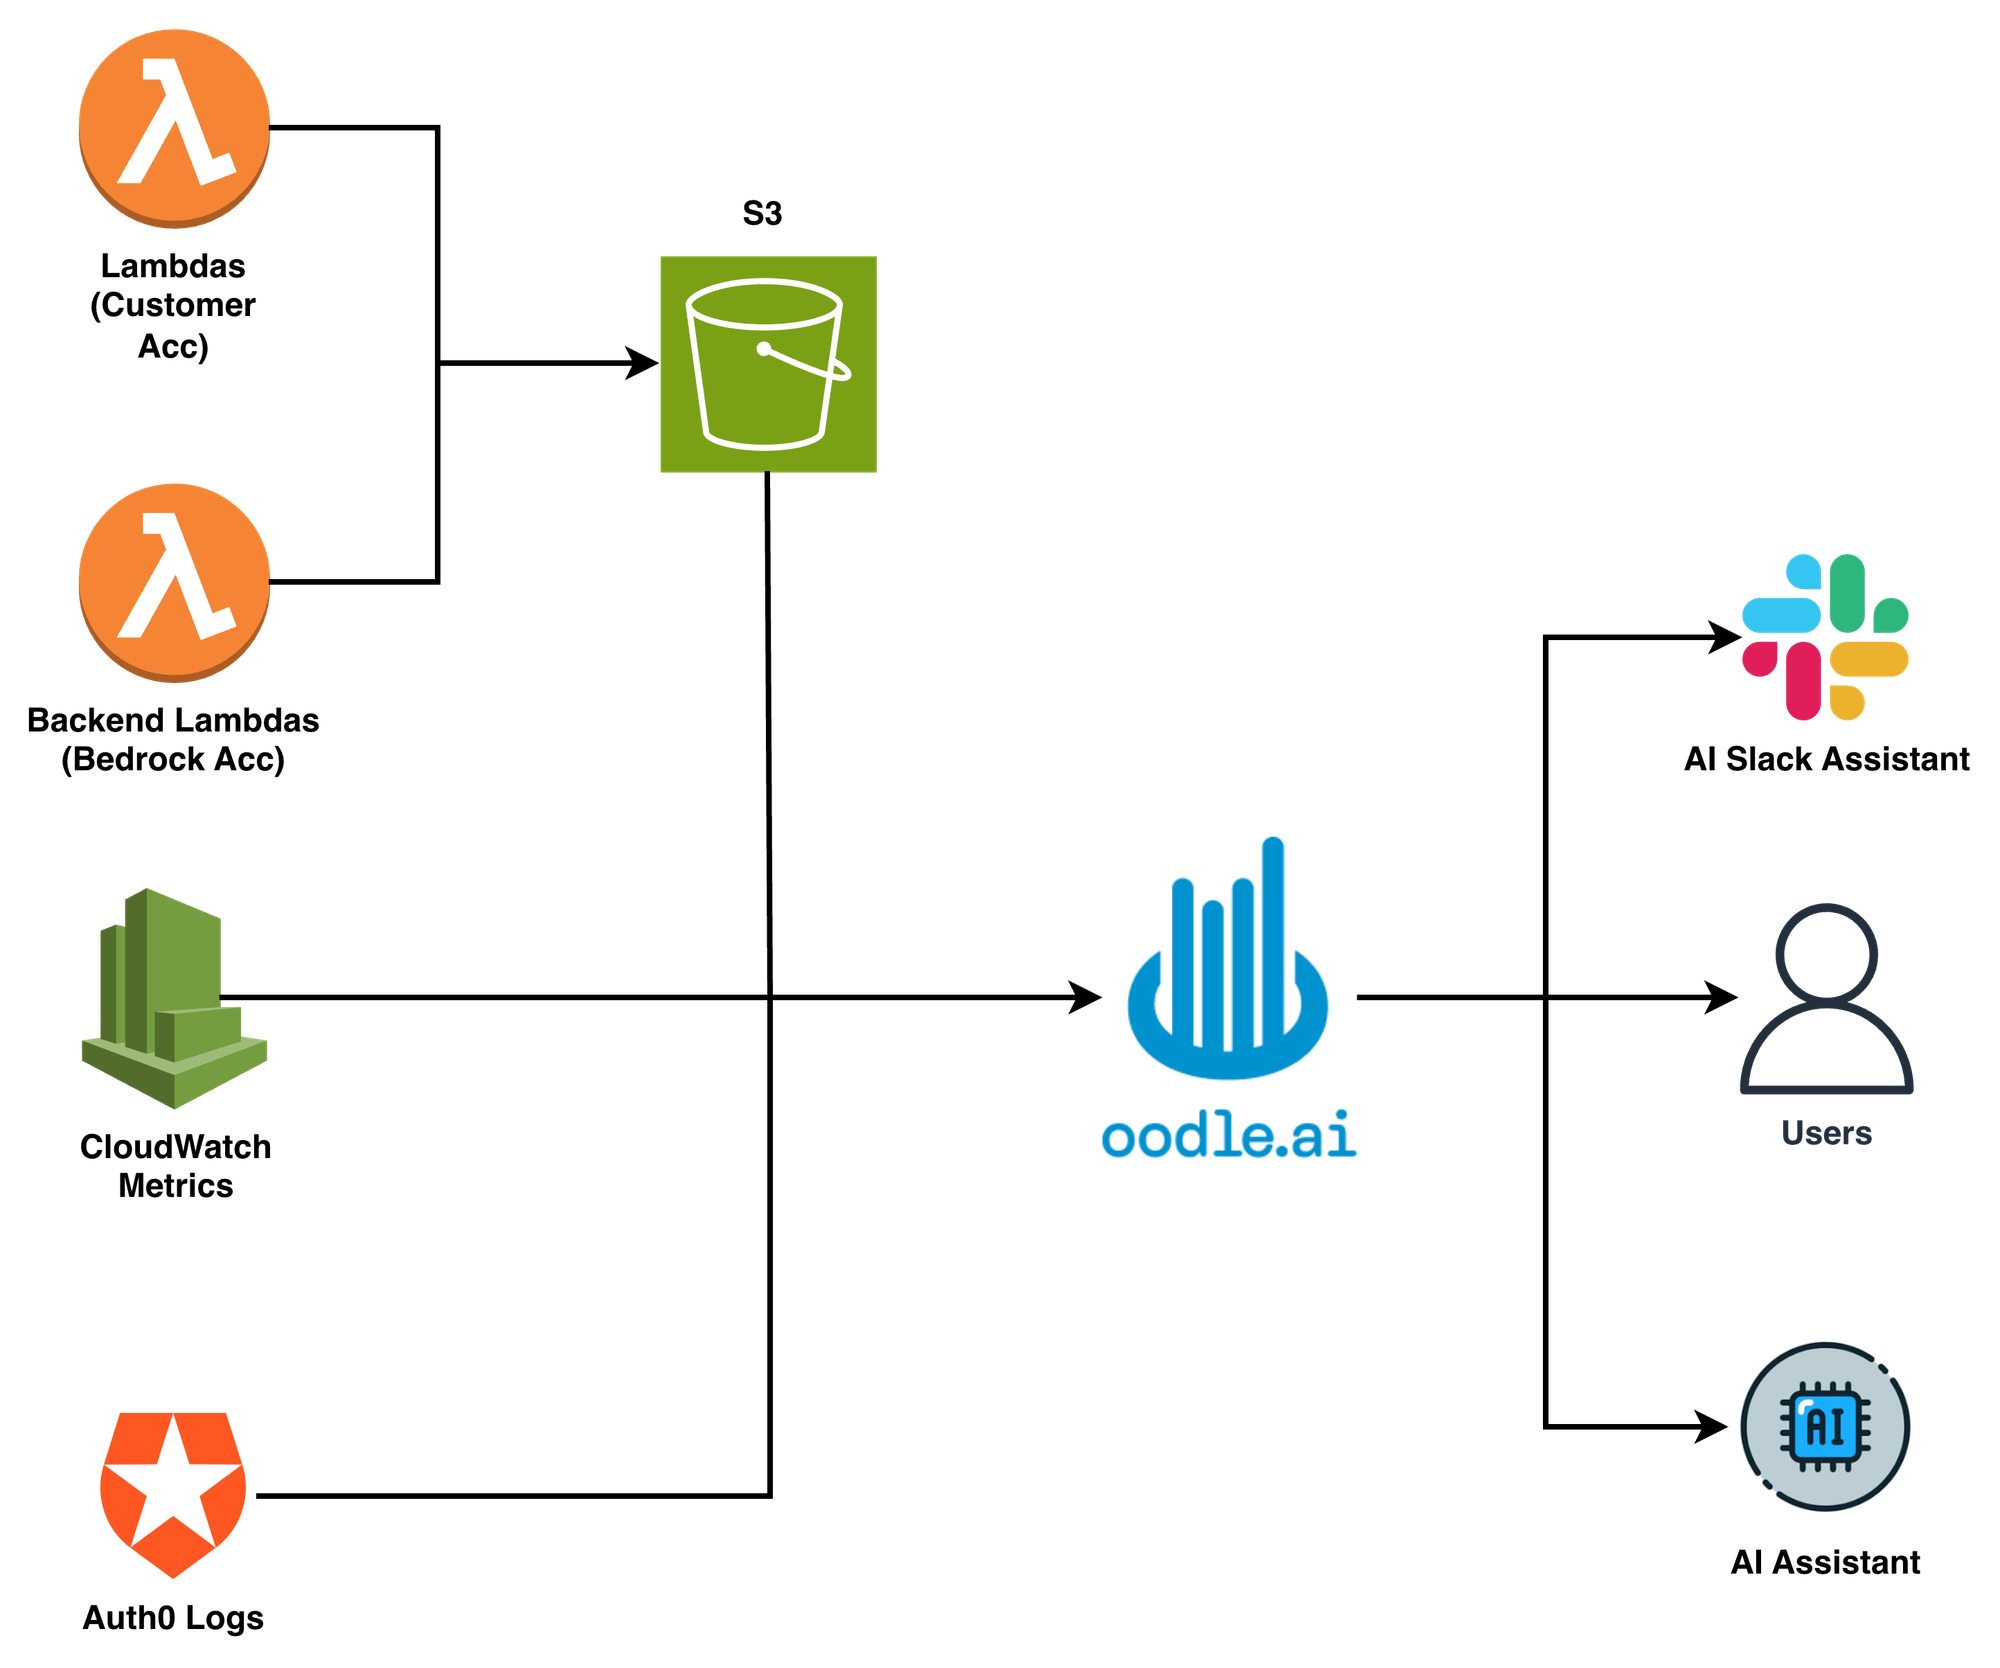
Bedrock Data builds data security posture management (DSPM): discovering, classifying, and protecting sensitive data across every major cloud and SaaS platform at a scale of many petabytes. Their deployment model makes observability unusually hard: "outposts" (Lambda-based workers) run inside customer environments, scaling to thousands per customer. On Bedrock's own side, another fleet of Lambda functions handles backend processing. Both sides ship logs to the same S3 bucket.
Like most fast-growing teams, Bedrock's observability stack had evolved alongside the product. Different tools came in at different stages, and depending on who you asked, you'd get a different answer about which one the team relied on.
Three Tools, Three Workflows, Zero Correlation
Their log analytics vendor worked well enough for ingesting unstructured logs from S3, but the team was outgrowing what it offered them.
Some engineers preferred CloudWatch for its proximity to Lambda metrics. Others had built custom scripts to pull logs from S3 for ad hoc analysis. The result was three different tools, three different workflows, and no shared language for debugging.
When something went wrong, the troubleshooting played out the same way: one person would dig into their log tool, another would check CloudWatch, a third would run a custom script against S3. Then they'd jump on Zoom and try to piece findings together across different tools, different query languages, different mental models.
"If I got a report from a customer, I'd go in and look at logs in our log tool. Engineers were doing other things. If we're all using different tools and different approaches, it's really hard to collaborate asynchronously."
– Olaf Stein
The cost wasn't just time. It was money: multiple tool subscriptions, engineers pulled from feature work, and the frustration of debugging that should have been simpler.
"If you have three engineers and me on a Slack channel or a Zoom call, any hour it takes longer costs actual money. It costs money, it costs productivity, and it causes frustration."
– Olaf Stein
The bigger challenge was correlation. As Bedrock matured, they needed Lambda metrics and application logs in the same workflow: monitoring to know something is wrong, logs to figure out what. Logs were well covered, but the team needed more than logs.
The Checklist That Narrowed the Field
The fragmentation was unsustainable. The Bedrock team knew what the next tool needed to look like, and had strong opinions about what would actually work.
Their requirements boiled down to four things:
- OpenTelemetry as a first-class citizen. Bedrock planned to standardize on OTel. Every vendor claimed support, but the team wanted native integration, not a bolted-on compatibility layer. The goal was a vendor-agnostic data pipeline built on the actual standard, not one that forced them into proprietary agents.
- Cost that scales. As a fast-growing startup, Bedrock's log volume was climbing daily. The tool couldn't break the bank while they cleaned up noisy telemetry.
- Less queries, more point-and-click. The team had seen adoption stall when tools required learning a proprietary query language. "Complex queries are often a roadblock to broad adoption."
- AI-native capabilities. Bedrock is an AI-native company. Observability tooling that could help with troubleshooting, and eventually integrate into the development cycle, was a strong differentiator.
The team evaluated a mix of established vendors and smaller players.
"I know enough about these tools and our unique requirements that in most cases, just reading the documentation tells me if something is viable or painful. Oodle checked all the boxes."
– Olaf Stein
One detail clinched it early: Oodle's S3 integration pulls logs directly from the customer's bucket, no Lambda functions deployed in Bedrock's account to do the fetching. "That's one of the main reasons I wanted to do this with you guys," Olaf said. "It's a direct pull integration. Many other vendors make you deploy Lambda functions. I would prefer not to have to do that."
Under Five Hours from Zero to Searching Logs
During the first PoC call, the team connected log ingestion, set up enrichment rules to extract structured fields from unstructured log data, and pulled in logs, Lambda metrics, and Auth0 logs.
"It took an hour to onboard the data. Another couple of hours for log transformations in the ingest pipeline. Getting us up and running probably took four or five hours end-to-end."
– Olaf Stein
One detail that mattered was custom lookup tables that map internal customer UUIDs to human-readable names, so engineers could filter by customer without memorizing GUIDs. With their previous vendor, maintaining these mappings meant manual query upkeep. In Oodle, it's built in.
Olaf's definition of a good onboarding? "I don't have to ask a single engineer for anything." He didn't have to.
One Tool, One Language, One Slack Thread
The change was immediate. Within the first week, Bedrock was resolving real incidents, not planning a months-long rollout.
Everyone in the same tool. Post-sales, sales engineers, and the engineering team now share a single platform. No more "which tool did you use to find that?" conversations.
Auto-correlation between logs and metrics. For Bedrock's Lambda-heavy backend, Oodle automatically stitches together function logs from S3 with CloudWatch metrics for the same function. Click a log line, see the corresponding invocation duration, error rate, and throttles. No manual joins, no switching tabs.
"The auto-correlation between our backend metrics and our backend logs is a great improvement to what we had before. That we can automatically stitch together different types of telemetry from the same service, that's something that in our previous world was much more cumbersome."
– Olaf Stein
No query language required. Oodle's log transforms extract the fields Bedrock's team cares about (customer ID, function name, log level) as clickable filters. Engineers search by clicking, not by writing queries. That drives faster adoption across the team. Engineers can focus on their actual work instead of learning a query language.
Faster collaborative debugging. The difference was clear during a late-night incident when a customer reported unusual outpost behavior. Three engineers jumped into a Slack channel. All three were using Oodle. They exchanged links to Oodle searches in Slack, each approaching the problem from a different angle.
Within 20 minutes they confirmed the issue. Within 35 minutes they'd identified the root cause, mitigated the problem, and notified the customer.
"We were all in the same tool. Before we did a Zoom call, we were on a Slack channel exchanging links to Oodle searches to show each other what we were each looking at. It was one of our faster conclusions."
– Olaf Stein
Performance that earns trust. Olaf runs longer time-range queries than most, looking at trends over weeks, not just the last hour. Search performance held up, even at those ranges, and at a price point that didn't force the team to choose between query speed and budget.
AI-native debugging. For an AI-native company like Bedrock, Oodle's AI capabilities are a natural fit, not a novelty. AI-driven root-cause analysis surfaces likely causes faster during incidents, and dashboards can be built in plain English. The barrier to investigation drops: anyone on the team can dig in, not just the engineers who know the query syntax.
"It Feels Like One Piece of Software"
What set Oodle apart wasn't any single feature. It was the integration.
Olaf had evaluated Grafana, and used it extensively in previous roles. His take was blunt: "Everything is very disjointed. If I had to pick between Datadog and Grafana, I would pick Datadog all day long. But of course nobody picks Datadog because it costs too much money."
Oodle hit a different spot, offering the integrated experience of Datadog at a price point a Series A startup could sustain.
"I would say Oodle is a fully baked, from-the-ground-up observability platform. I would describe it as: looks and feels a lot like Datadog, but a lot cheaper."
– Olaf Stein
The team at Oodle made the difference too. Features Olaf asked for showed up fast. Questions got answers quickly. For a growing company evaluating a newer vendor, that responsiveness was the trust signal.
Oodle's AWS Lambda monitoring
What's Next
Bedrock's observability story is just getting started. The immediate priority is standardizing on OpenTelemetry by standing up an OTel collector to control what telemetry goes where. From there, the roadmap includes adding custom metrics from application code and eventually producing traces.
"OpenTelemetry is native and front and center to what you guys do. It's not bolted on, like with many of the older vendors who existed before OpenTelemetry was a thing. I want a data pipeline that is completely vendor-agnostic, and I believe with Oodle we can get there."
– Olaf Stein
There's also interest in pushing Oodle's AI capabilities deeper, not just for runtime troubleshooting but into the development cycle itself. For an AI-native company, observability that shifts left is a natural next step.
For now, though, the foundation is set. One tool. One workflow. Everyone on the same page.
"People can do the same things they were doing before, plus things we couldn't do before. The adoption curve is pointing much more upwards than with any other tool."
– Olaf Stein