
Observability for AI Applications Using Oodle and OpenLIT
Instrument LLM apps and agents with OpenLIT in one line and ship both metrics and traces to Oodle

Most LLM Observability Tutorials Stop at One Chat Call
Most "add observability to your LLM app" walkthroughs cover the same ground: openlit.init(), one chat.completions.create(), and a screenshot of a token counter.
Production systems fan out much further. One user request to an agent turns into a model call, a vector DB lookup, one or more tool invocations, and often a hand-off to another agent, repeated several times before a response comes back. When a request is slow, costs too much, or returns the wrong answer, a token count won't tell you where to look. The questions you need answered:
- Which step in the chain was slow or expensive?
- Did the agent loop on a tool call?
- Which model or model version drove the cost or latency spike?
- Is retrieval returning junk context?
This post wires up OpenLIT, an OpenTelemetry-native SDK that auto-instruments 50+ LLM providers, agent frameworks, and vector DBs with one line of code, and ships both the agent traces and metrics it produces to Oodle. It goes past the one-chat-call demo into agent span trees you can walk in Oodle's Agent Observability and into Oodle's AI Canvas, where you can query those traces, metrics, and alerts in plain English.
The Stack

OpenLIT emits standard OpenTelemetry gen_ai.* traces and metrics. The OTel Collector forwards both to Oodle, which stores metrics behind a Prometheus-compatible datasource and traces in its Trace Explorer. A cost or latency spike on a metric chart links back to the span tree that produced it.
Instrument Your App in One Line
Install the SDK:
pip install openlitAdd two lines to your entry point:
import openlit
openlit.init()
With no endpoint configured, OpenLIT prints telemetry to your console, which is handy during local development. To ship to Oodle via a collector, set the endpoint. Here are the parameters that matter, straight from the current `openlit.init()` signature:
import openlit

openlit.init(
        # preferred;application_name is a deprecated alias
        service_name="checkout-agent",
        environment="production",
        # your OTel Collector's HTTP endpoint
        otlp_endpoint="http://127.0.0.1:4318",
        # capture prompts/completions on spans
        capture_message_content=True,
        # bounded label on every metric
        custom_metrics_attributes={"team": "platform-ai"},
)
Or keep it to openlit.init() and configure everything through standard OpenTelemetry environment variables:
export OTEL_EXPORTER_OTLP_ENDPOINT="http://127.0.0.1:4318"
export OTEL_SERVICE_NAME="checkout-agent"
export OTEL_DEPLOYMENT_ENVIRONMENT="production"
💡 service_name and application_name both map to OTEL_SERVICE_NAME; environment maps to OTEL_DEPLOYMENT_ENVIRONMENT. service_name wins if both are passed.
That single init() auto-instruments everything OpenLIT supports. You write no manual spans. Coverage includes agent frameworks (LangGraph, CrewAI, AG2, Agno, Pydantic AI, OpenAI Agents SDK, Claude Agent SDK, Google ADK, Letta, Smolagents), LLM providers (OpenAI, Anthropic, Bedrock, Vertex AI, Mistral, Groq, Ollama, vLLM, and more), and vector DBs (Pinecone, Chroma, Qdrant, Milvus, Astra). The full list lives under sdk/python/src/openlit/instrumentation.
A Real Agent, Instrumented
A LangGraph ReAct agent with a search tool, monitored end to end with no instrumentation code beyond init():
import openlit
from langchain_anthropic import ChatAnthropic
from langchain_community.tools.tavily_search import TavilySearchResults
from langchain_core.messages import HumanMessage
from langgraph.checkpoint.memory import MemorySaver
from langgraph.prebuilt import create_react_agent

openlit.init(service_name="research-agent", environment="production",
                 otlp_endpoint="http://127.0.0.1:4318")

model = ChatAnthropic(model="claude-sonnet-4-5")
search = TavilySearchResults(max_results=2)
agent = create_react_agent(model, [search], checkpointer=MemorySaver())

config = {"configurable": {"thread_id": "abc123"}}
for chunk in agent.stream(
        {"messages": [HumanMessage(content="whats the weather where I live?")]}, config
):
    print(chunk)
What "One Line" Captures
Every instrumented call produces spans following the OpenTelemetry GenAI semantic conventions, extended by OpenLIT (sdk/python/src/openlit/semcov/__init__.py). A single agent turn produces a tree you can open as a waterfall in Oodle's Agent Observability Trace View:
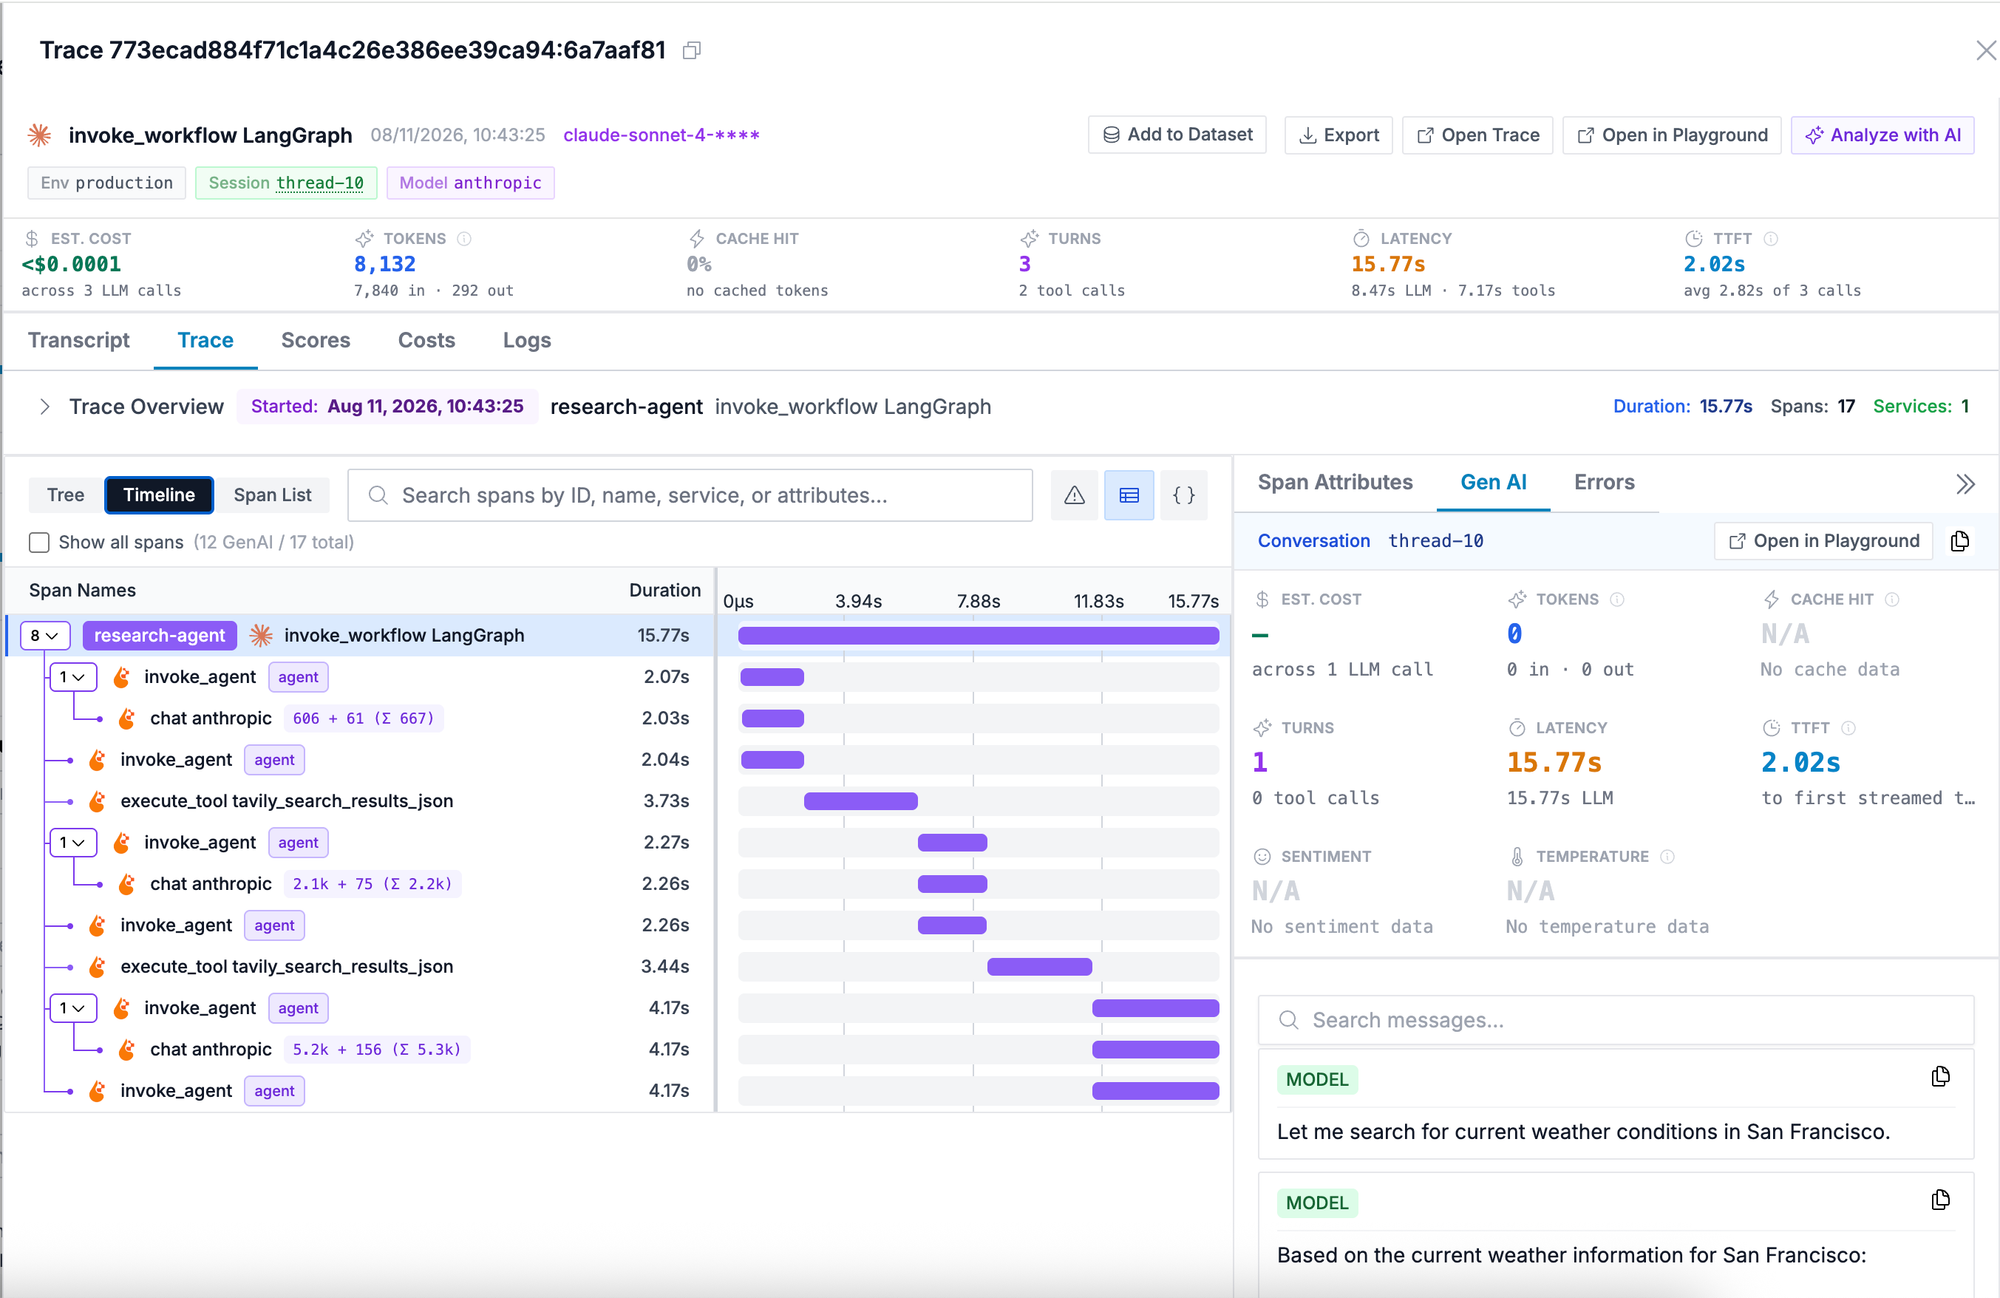
Key attributes captured per span:
gen_ai.operation.name:chat,invoke_agent,invoke_workflow,execute_tool,create_agent,embeddings,vectordbgen_ai.provider.name,gen_ai.request.model,gen_ai.response.modelgen_ai.usage.input_tokens,gen_ai.usage.output_tokens,gen_ai.usage.cache_read.input_tokensgen_ai.usage.cost, an OpenLIT extension (not part of the OTel semconv), computed from pricing_jsongen_ai.tool.name,gen_ai.tool.call.id,gen_ai.conversation.iderror.type:rate_limited,timeout, authentication,server_error, …
On the metrics side, init() registers these instruments (sdk/python/src/openlit/otel/metrics.py):
| Metric | Type | Unit | Notable labels |
|---|---|---|---|
| gen_ai.client.token.usage | histogram | {token} | gen_ai.token.type (input/output), gen_ai.request.model, gen_ai.operation.name |
| gen_ai.client.operation.duration | histogram | s | gen_ai.operation.name, gen_ai.request.model, error.type |
| gen_ai.usage.cost | histogram | USD | gen_ai.request.model, gen_ai.provider.name |
| gen_ai.server.time_to_first_token | histogram | s | gen_ai.request.model |
| db.client.operation.duration / | |||
| db.total.requests | histogram / counter | s/, | db.system.name, db.operation.name |
Your custom_metrics_attributes (e.g. team) and resource attributes ride along as labels. Note Oodle's OTLP-to-Prometheus mapping: dots become underscores, and service.name maps to the job label (service.instance.id → instance). So the service_name="research-agent" you set at init() is queried as job="research-agent"; deployment.environment stays deployment_environment.
Point the Collector at Oodle
Grab your OODLE_INSTANCE (instance identifier) and API_KEY from your Oodle account. OpenLIT talks OTLP to the collector, and the collector forwards both signals to Oodle over otlphttp (Oodle OTel docs):
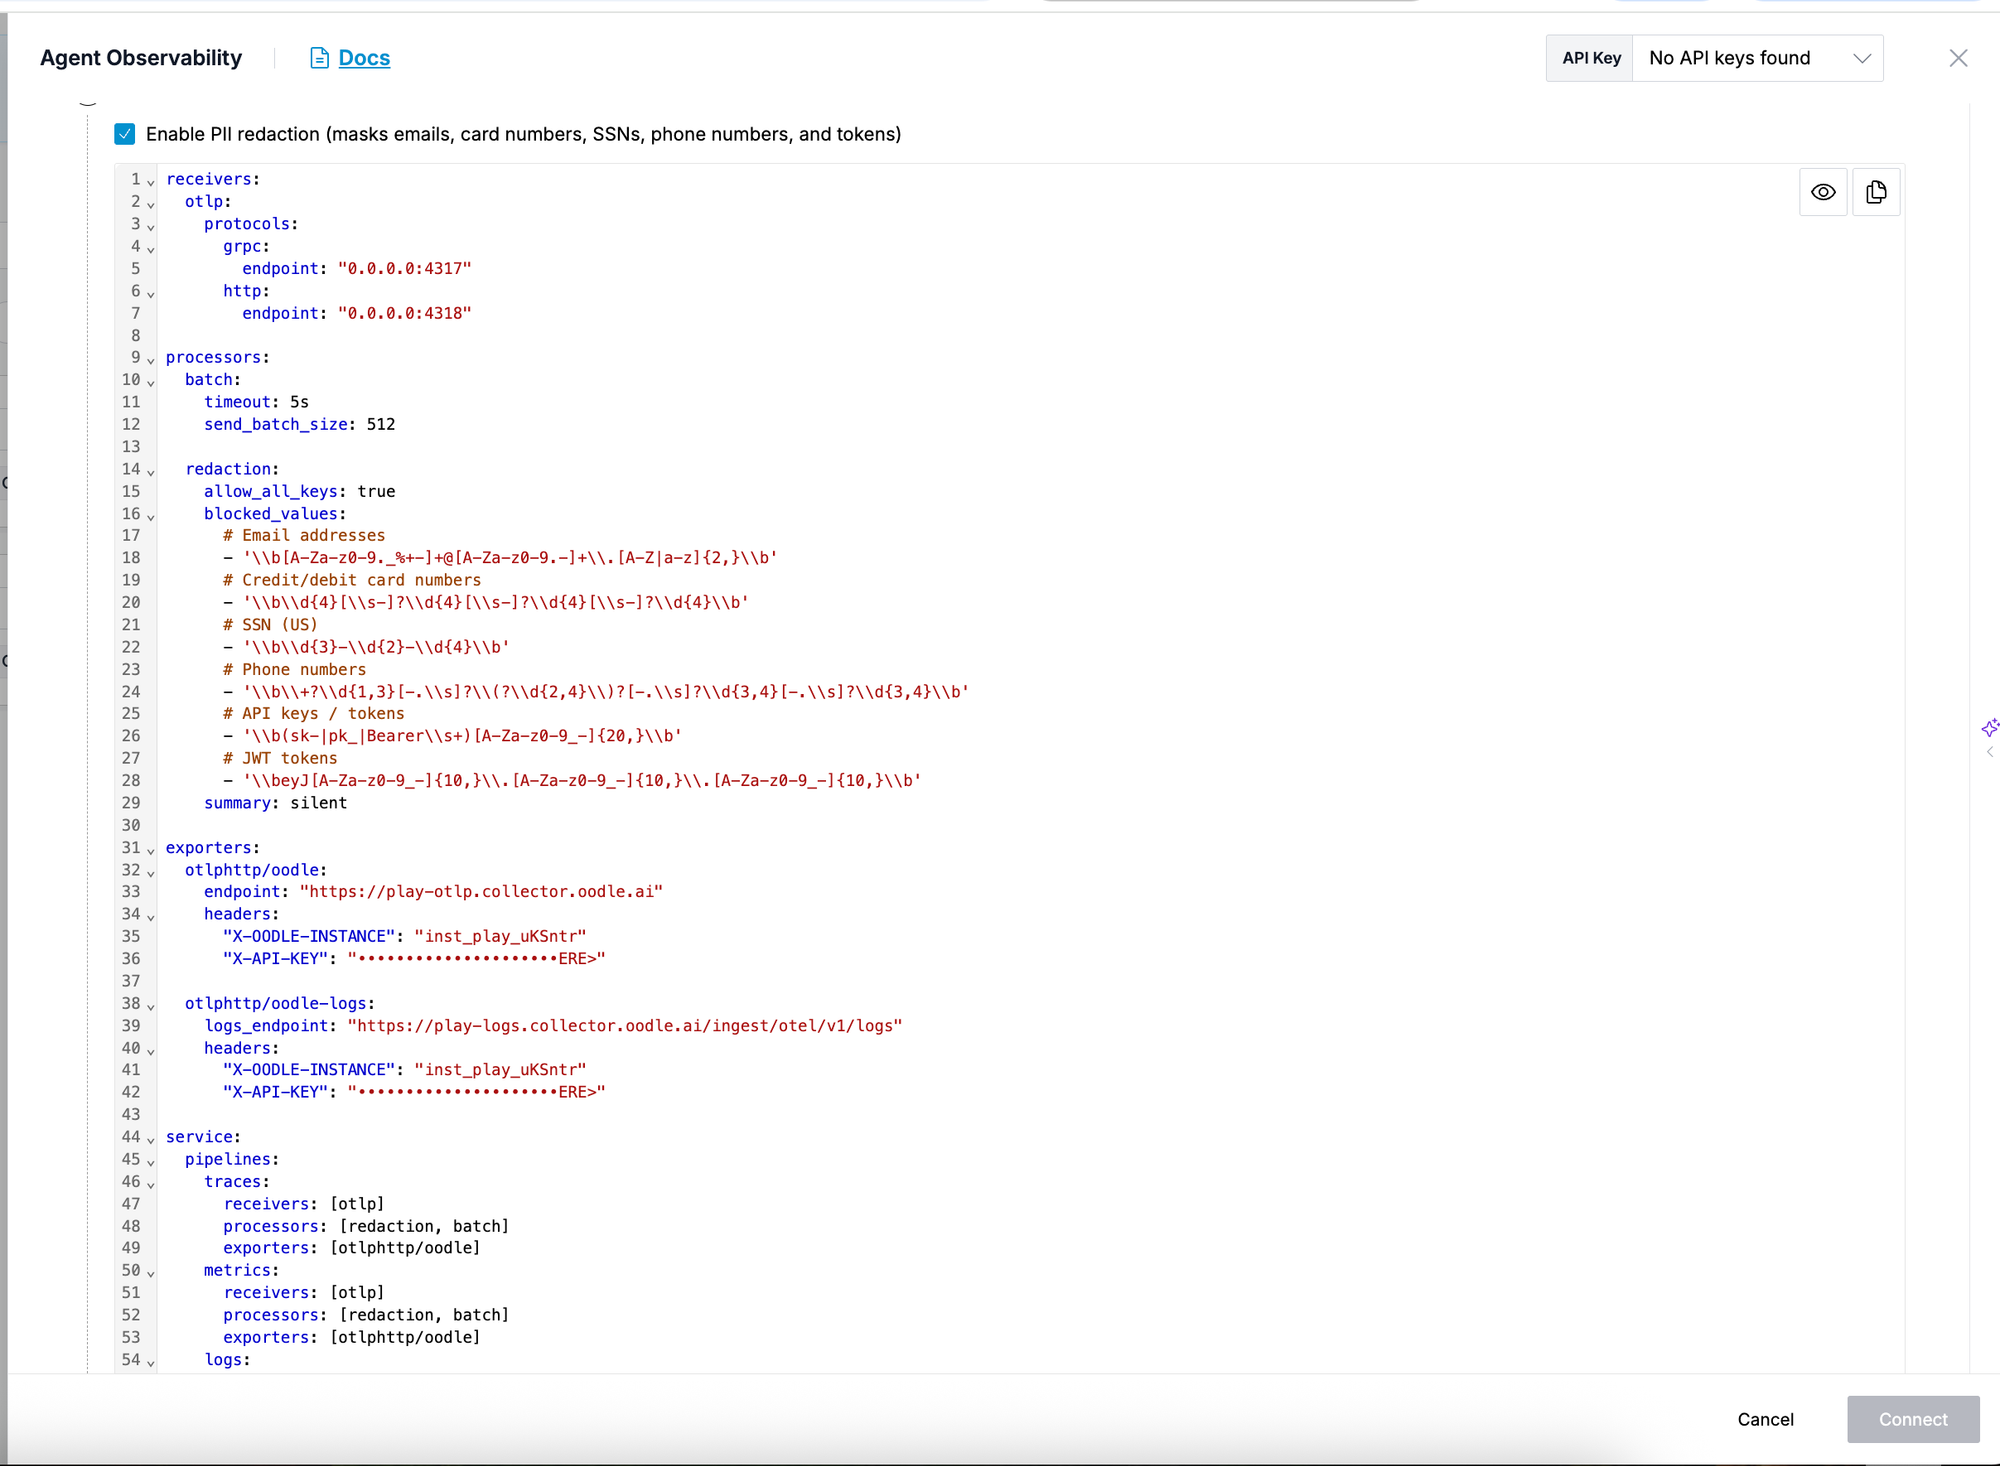
Both X-OODLE-INSTANCE and X-API-KEY headers are required. Confirm the exact endpoint host and paths for your instance in the Oodle OpenTelemetry integration tile. They're instance-specific.
By default Oodle ingests all traces (no sampling). Oodle's architecture keeps the cost of full retention low. LLM workloads are non-deterministic, so you cannot predict which requests you must inspect later.
If you must sample for other reasons, do it at the collector or in the SDK before traces reach Oodle.
Agent Observability in Oodle
Once metrics and traces land, Oodle gives you:
- Traces List: search and filter by model, agent name, operation, latency, cost, sentiment, and error state. Full-text search across prompt input and output content. Click any trace to open the detail view.
- Agent Transcripts: the full conversation rendered as a chat UI: system instructions, user prompts, assistant responses, tool calls, and reasoning blocks. For multi-agent traces, toggle "By Agent" to group messages by gen_ai.agent.name. Search across all messages with highlighted matches.
- Out-of-the-box Insights: rule-based detection of anomalies in Agent Traces categorized by type (Quality, Efficiency, Resource, Performance) and severity. Points to slow, costly, and low-quality steps in your trace data.
- Trace Waterfall: the full request lifecycle as a waterfall. Non-GenAI infrastructure spans auto-collapse so you focus on the AI flow; toggle "Show all spans" to reveal them. Each GenAI span shows model, tokens, cost, and has sub-tabs for Overview, Gen AI stats, Transcript, and Errors.
- Evaluators: automatically score LLM spans for quality, accuracy, and compliance. Two types: LLM-as-Judge (calls an LLM to assess relevance, hallucination, helpfulness, toxicity, correctness, conciseness, or custom criteria) and Code evaluators (deterministic regex, JSON schema, or keyword checks in a microVM). Evaluator rules run continuously on matching spans at a configurable sampling rate; scores appear on the Traces and Scores tabs.
- Playground: interactive prompt testing environment. Select any LLM connection and model, define tool schemas for function calling, use template variables ({{variable_name}}), and compare outputs across up to four models side by side. Seed the Playground directly from a production trace ("Open in Playground") to replay and iterate on real conversations without leaving Oodle.
- Datasets & Experiments: create datasets of input/expected-output pairs (manual entry, CSV import, or captured from production traces via "Add to Dataset"). Run experiments: pick a model, attach evaluators, optionally wrap inputs in a prompt template, and score every item in the dataset. Compare runs over time to catch regressions before they ship.
- Agent Graph: interactive topology showing how agents, tools, and LLM calls connect. Each node shows request count, error rate, and average latency. Click a node to see decision paths (outgoing connections with probability and latency), filtered traces, and per-node insights.
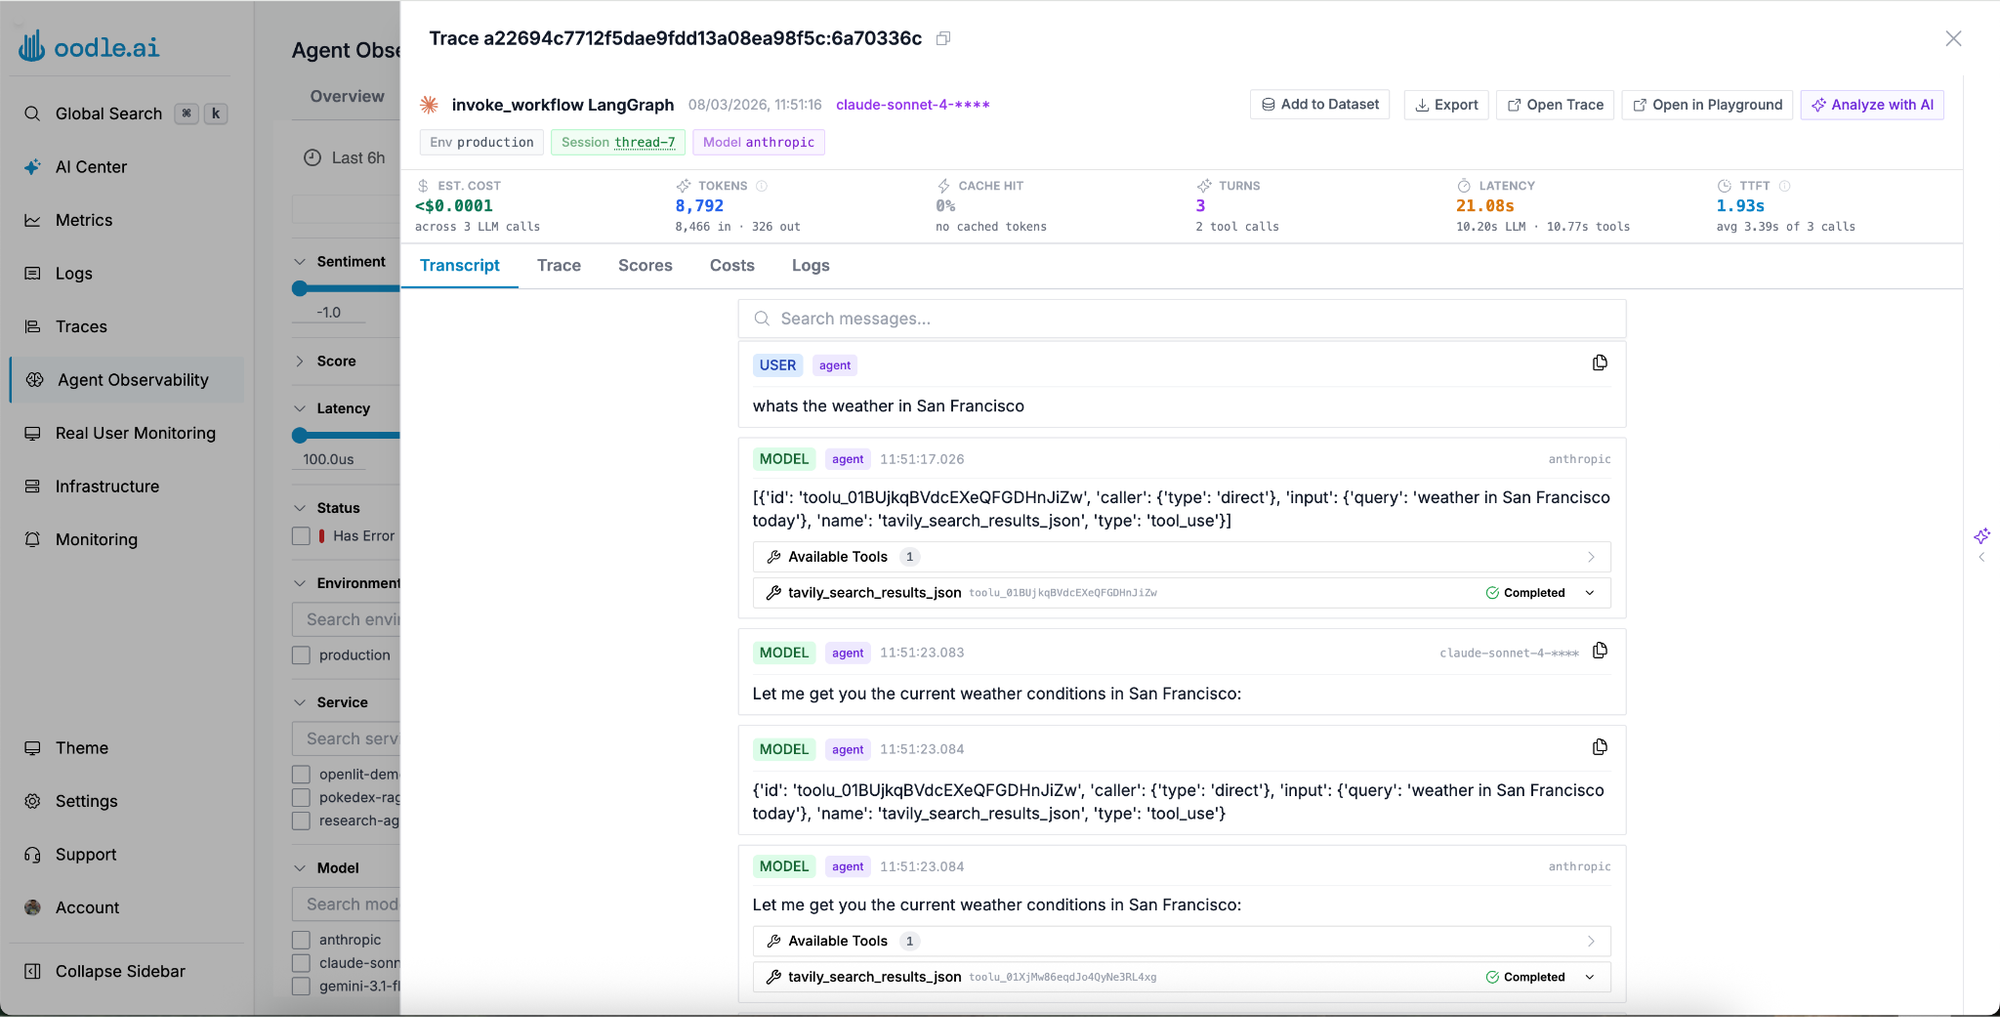
This is where the high-cardinality fields live: pivot on gen_ai.conversation.id to reconstruct a full conversation, or on gen_ai.tool.call.id to trace a single tool invocation. Point lookups like these are cheap in traces and very expensive in a metrics backend.
Debug with AI
Oodle exposes its observability backend as an MCP server, so any MCP-compatible assistant (Cursor, Claude Desktop, or your own agents) can query traces, run PromQL, and inspect alerts from whatever AI coding tool you already use.
Inside Oodle, the AI Canvas lets you investigate in plain English:
- "Which model had the highest p95 latency this week?"
- "Show me traces where the agent looped on execute_tool more than 3 times"
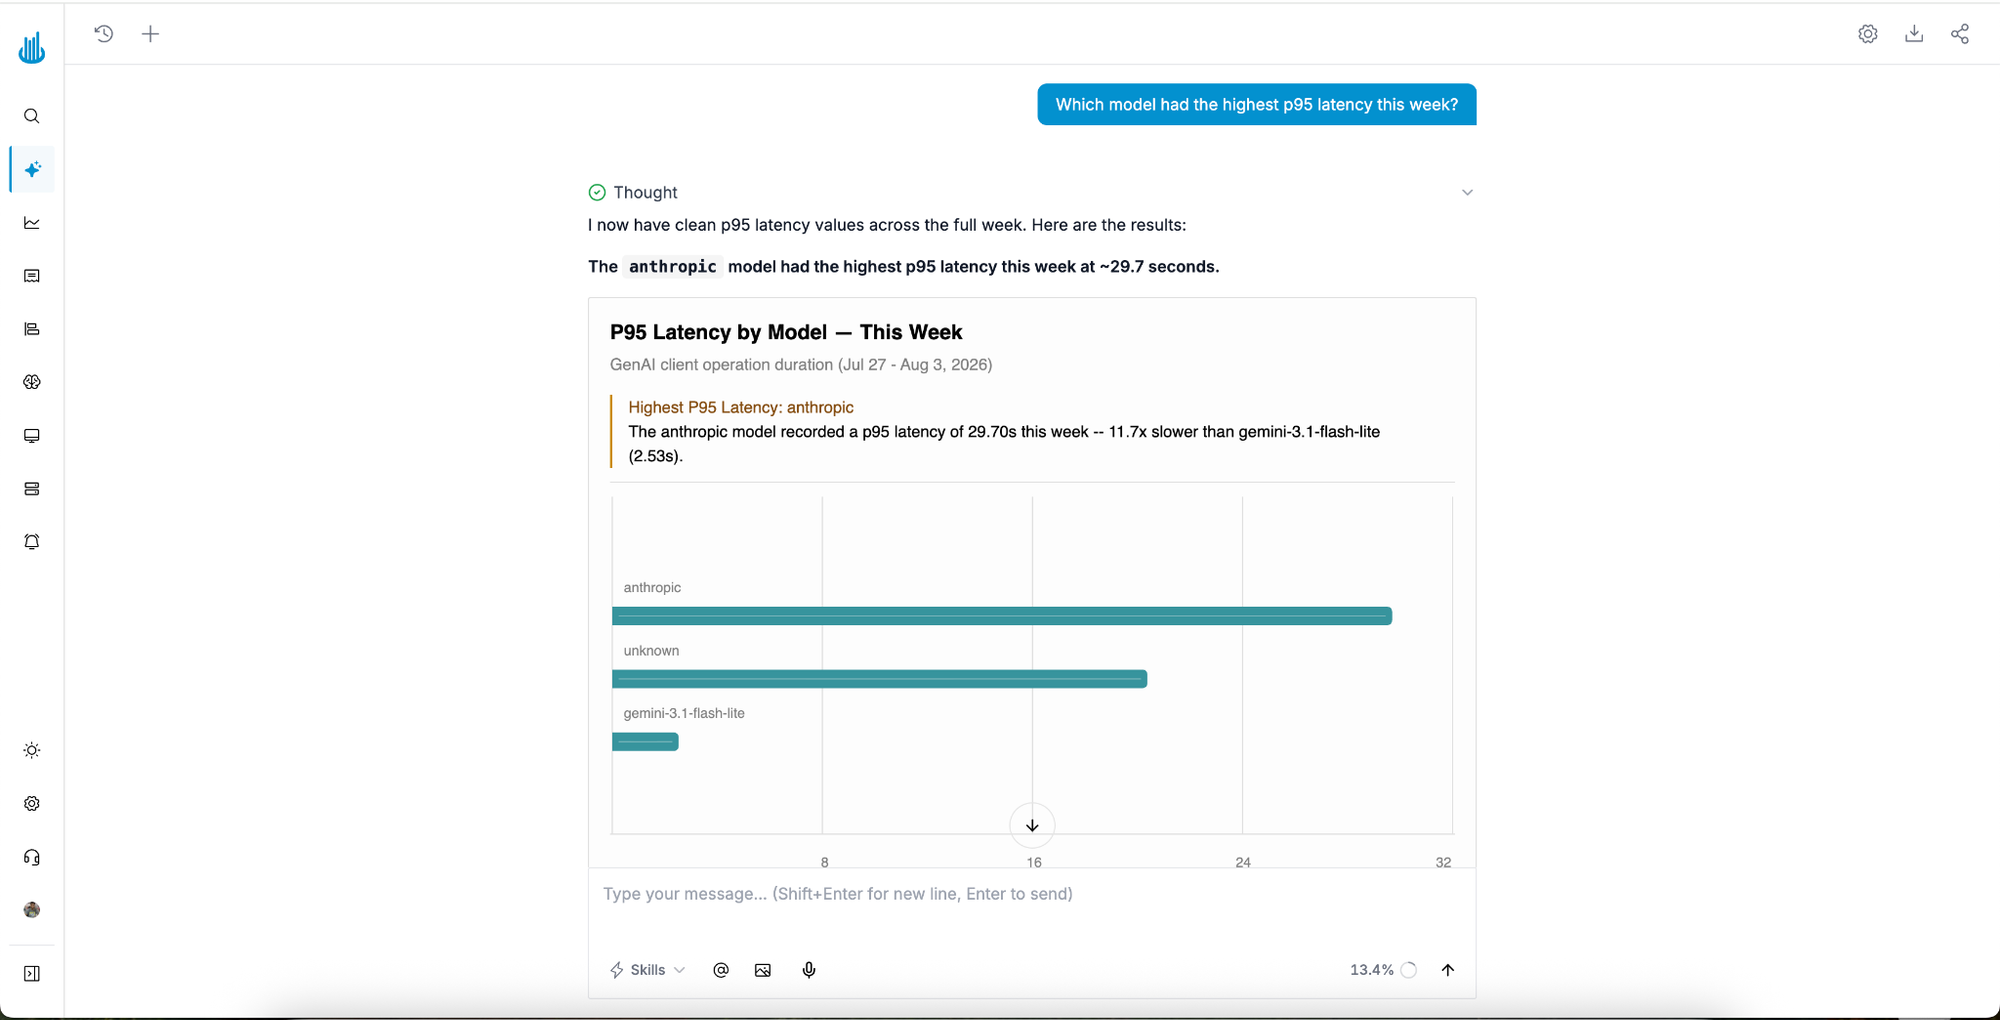
It translates your question into the right query, executes it against live data, and renders results in the canvas: span trees, metric charts, and cost breakdowns. All signals OpenLIT ships are queryable, so you get from "something feels slow" to the exact span responsible in a few questions.
Metric Queries to Start With
Oodle's metrics datasource is Prometheus-compatible, so these are standard PromQL. (Histograms expose _sum/_count/_bucket; whether Oodle appends unit suffixes like _seconds depends on your instance, so adjust names to what appears there.)
1. Cost tracking per team. Tag calls with custom_metrics_attributes={"team": "..."} at init(), then roll up the cost histogram:
sum by (team) (increase(gen_ai_usage_cost_sum[1h]))2. Catch runaway agent loops. A spike in execute_tool operations per minute usually means an agent is stuck retrying:
sum by (job) (rate(gen_ai_client_operation_duration_count{gen_ai_operation_name="execute_tool"}[1m]))3. Per-model latency (p95). Spot a model or version regressing:
histogram_quantile(0.95, sum by (le, gen_ai_request_model) ( rate(gen_ai_client_operation_duration_bucket[5m])))4. Provider error rate. Errors carry an error.type label. Watch the failing fraction per provider:
sum by (gen_ai_provider_name) (rate(gen_ai_client_operation_duration_count{error_type!=""}[5m])) / sum by (gen_ai_provider_name) (rate(gen_ai_client_operation_duration_count[5m]))5. Input vs output token mix. The token metric splits on gen_ai.token.type, useful for spotting prompt bloat:
sum by (gen_ai_token_type) (rate(gen_ai_client_token_usage_sum[5m]))Note: cache_read tokens are recorded as span attributes, not on the gen_ai.client.token.usage metric (the semconv allows only input/output there), so cache-hit-rate comes from spans in the Trace Explorer.
Monitors
Oodle provides out-of-the-box monitors which can be provisioned in a click of a button on the OpenLIT integration tile:

Users can create any additional monitors on any of the metrics emitted by OpenLIT.
A Note on Cardinality
Oodle supports high-cardinality metric labels (conversation.id, response.id, user.id, tool.call.id) as well. These are useful for filter_by, group_by operations.
OpenLIT keeps this information in spans too. Look for it in Oodle's Agent Observability traces. Metrics answer "how much / how fast across the fleet"; traces answer "what happened in this one request."
Import the Pre-Built Dashboard
Oodle provides out-of the-box dashboards for OpenLIT which can be provisioned in a click of a button on the OpenLIT integration tile:

When to Use This Setup
This stack fits when you want vendor-neutral, OpenTelemetry-native AI observability: one line of instrumentation, no lock-in to a proprietary SDK, and both metrics and traces flowing into a single backend. You query the metrics with PromQL and chart them in Grafana. You walk the traces as waterfalls in Oodle's Agent Observability. Because it's all OTLP, you switch or add a backend by editing the collector config. Your app code stays the same.
FAQ
Do I need to change my app code to switch backends? No. OpenLIT emits standard OTLP; you re-point the collector's exporter. The init() call stays the same.
application_name or service_name? Use service_name. application_name still works as a deprecated alias (both map to OTEL_SERVICE_NAME). In Oodle metric queries, that value shows up as the job label.
How is cost calculated? From a pricing table; override the default with the pricing_json argument to init() for custom or fine-tuned models. gen_ai.usage.cost is an OpenLIT extension, not part of the OTel GenAI semconv.
For advanced configuration (disabling instrumentors, GPU metrics, guardrails, prompt/secret management), see the OpenLIT README.