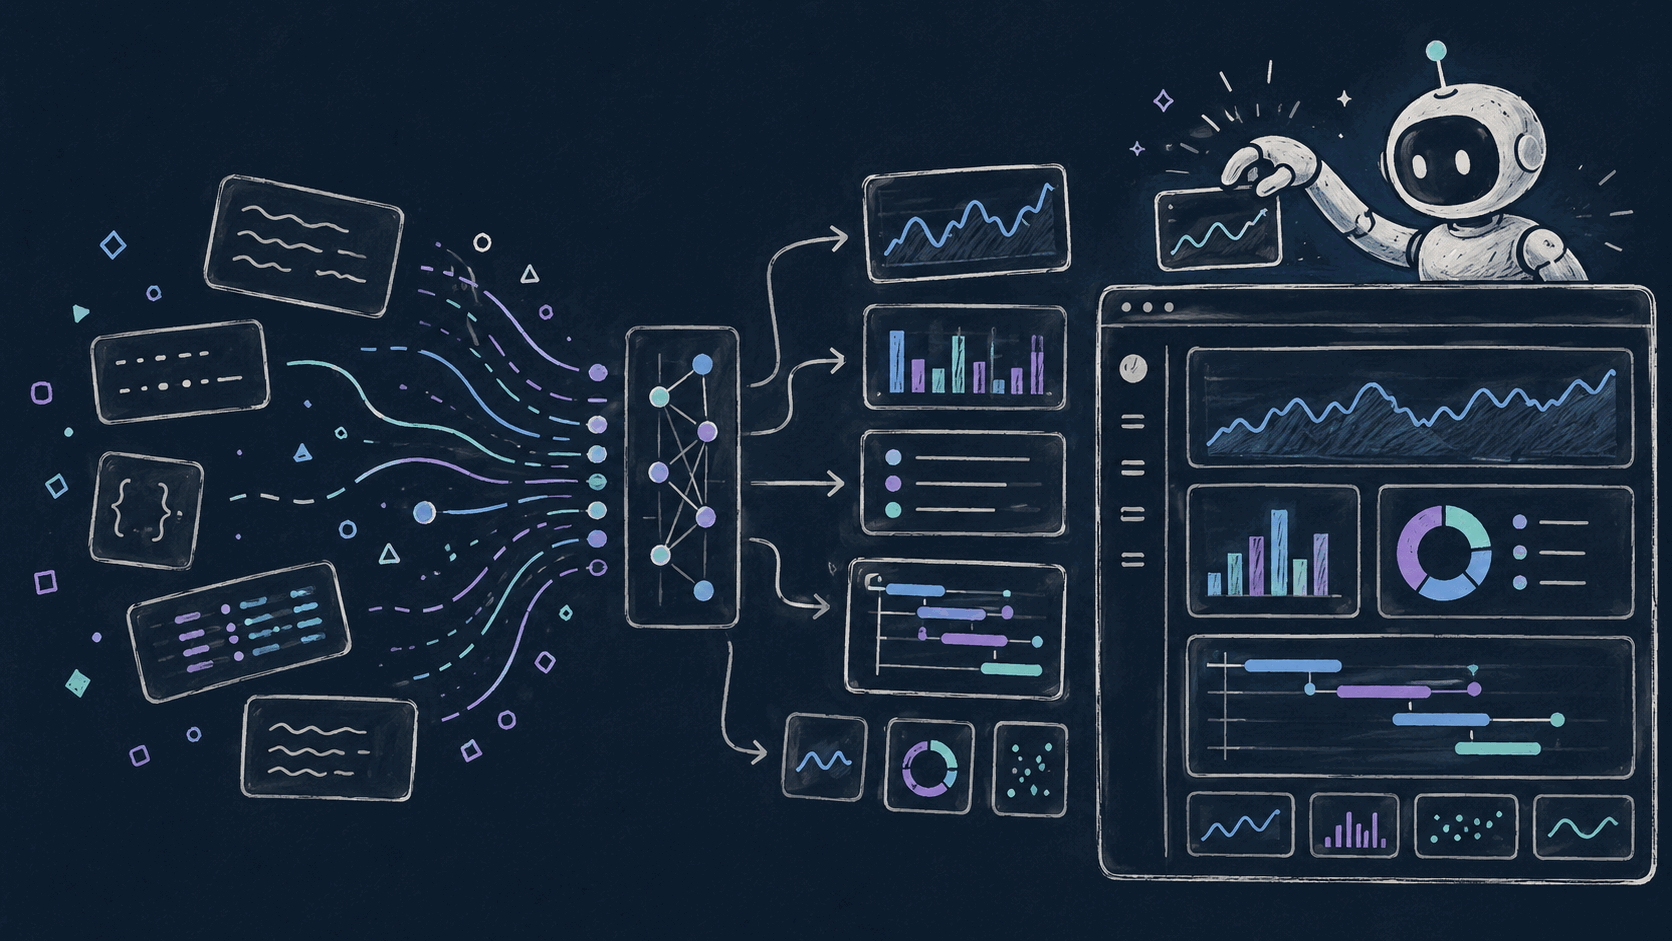
How we taught our AI to draw
We tried making our AI write JSON to render UI components. It worked, until OpenUI showed us the better interface was declarative text.

Our AI assistant could query metrics, search logs, and trace requests across services. It could find the bad pod, the noisy endpoint, the suspicious deployment, and the metric that started bending at 02:13.
Then it would explain all of that in a wall of text.
Sometimes it got fancy and made a markdown table, which is the observability equivalent of printing a dashboard and taping it to your monitor.
This is the story of how we went from link unfurling, to a custom JSON artifact format, to OpenUI, and what we learned about getting LLMs to produce visual output that people actually want to use.
First, the AI Needed Receipts
Before we could render anything interesting, we had to fix a more basic problem: our tools returned data, but not evidence.
Every tool our AI calls, including promql_query, query_logs_with_filters, and query_traces, returns structured output. The model could summarize that output, but the user could not always jump straight to the source. If the AI says "CPU spiked on this container," it should also hand you the exact query, time range, and viewer that support the claim.
So we added a Link to every tool result. When promql_query runs, it returns the time series and also generates the Oodle Metrics Explore URL for that exact query, time range, and datasource:
return ToolResult(
    result=result_json,
    link=Link(
        uri=explore_uri,
        data={"query": query, "start_time": start_time, "end_time": end_time},
    ),
    num_results=len(processed_results),
)
Logs and traces got the same treatment. Any tool that fetches observable data now returns a companion link to the interactive view for that data.
The link field has two parts: uri, the actual URL path, and data, the structured inputs behind it. data lets the frontend render the link differently depending on context - a log link can unfurl into an embedded log viewer, a metrics link into a chart, each using the structured inputs to configure the component.
That was the foundation. Without Link on ToolResult, there was nothing to unfurl.
Attempt 1: Unfurl the Page We Already Had
Once tools produced links, the first product idea was obvious.
The frontend already knew how to render Oodle metric panels inline. When the AI returned an Oodle Metrics Explore link, we detected it, parsed the query parameters, and rendered the chart inside the message. We handled Oodle Logs links the same way: parse the URL, derive the query state, and mount an embedded log viewer.
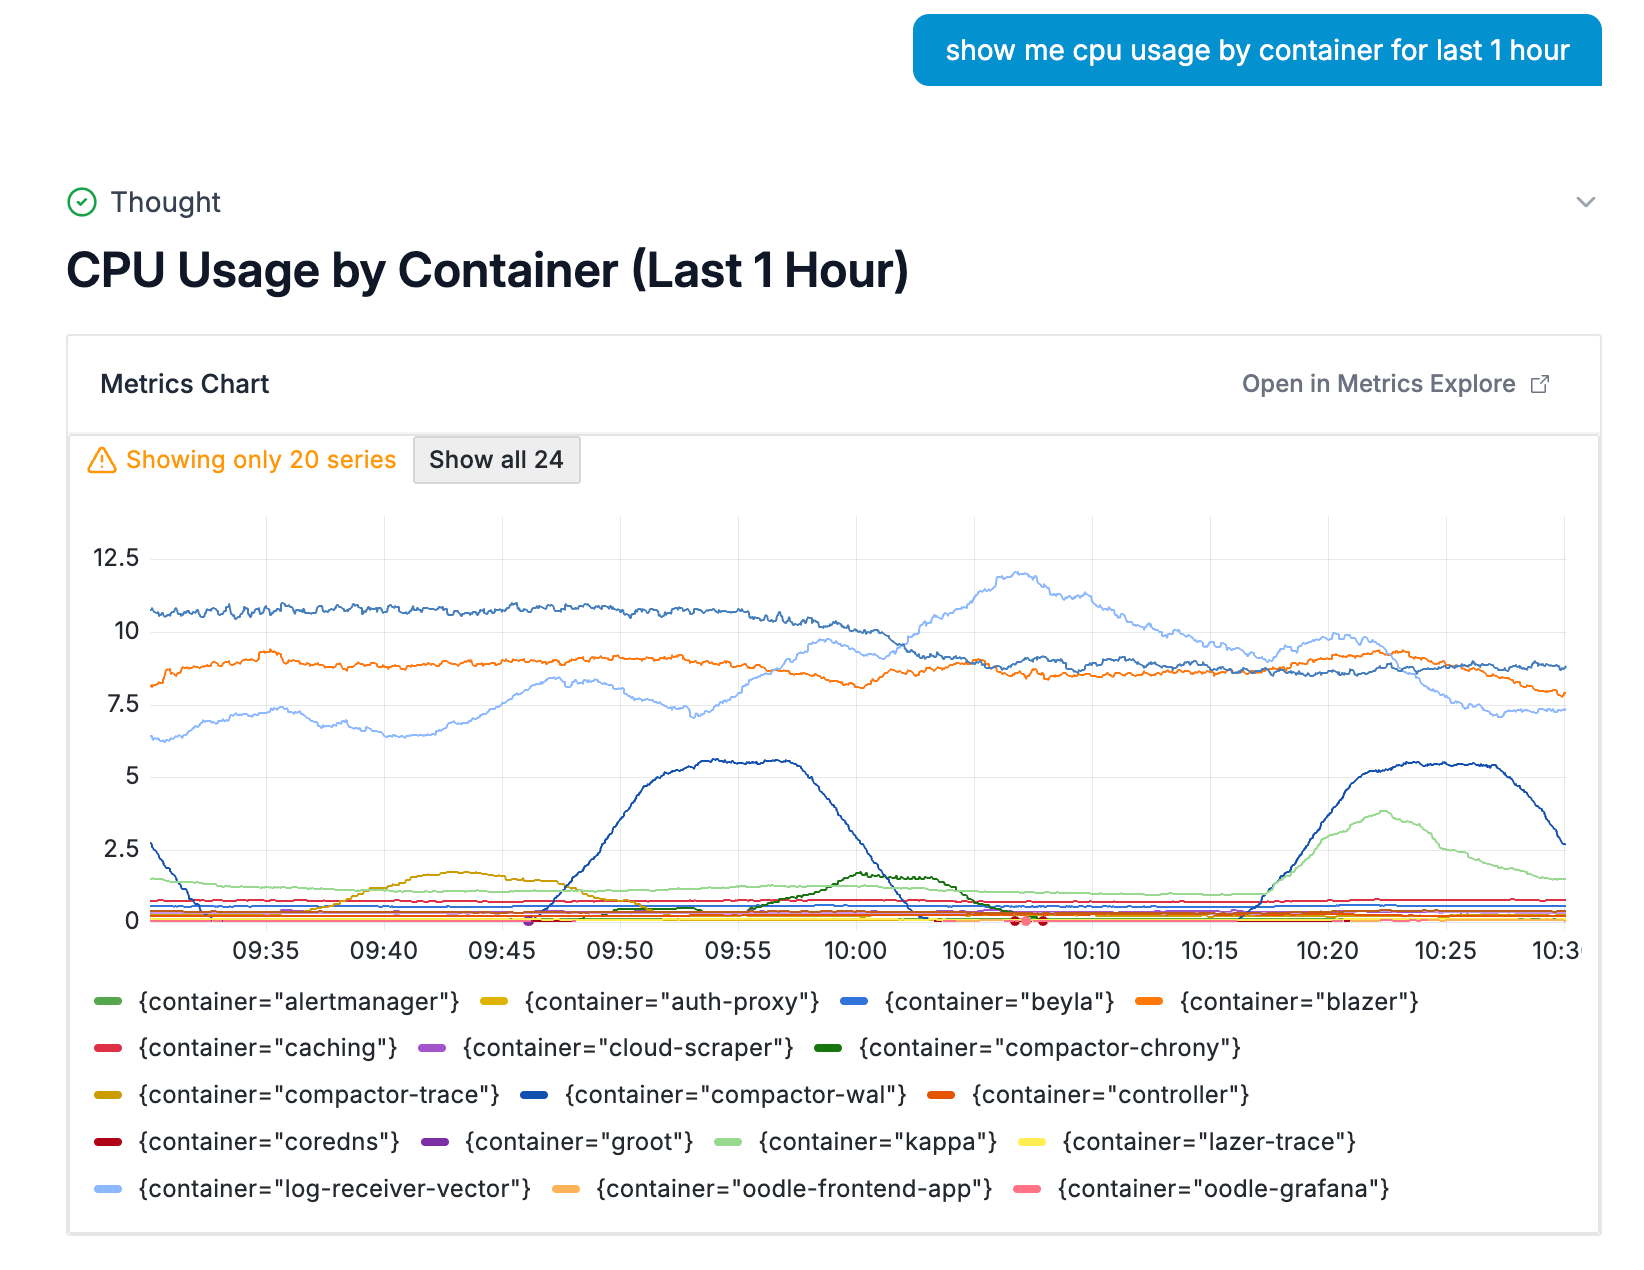
It worked right away. An engineer could ask "show me CPU usage by container" and get a live, interactive chart instead of a plain hyperlink.
We also started steering the model toward these rich links instead of markdown tables. When the log aggregation tool returned results, it included an explorer link, and the model learned to use it.
But link unfurling hits a wall quickly: you can only unfurl things that already exist as pages in your product.
Want to show a summary card with three KPIs and a warning callout? There is no URL for that.
Want a small bar chart comparing error rates across five services, without creating an Oodle dashboard first? Also no.
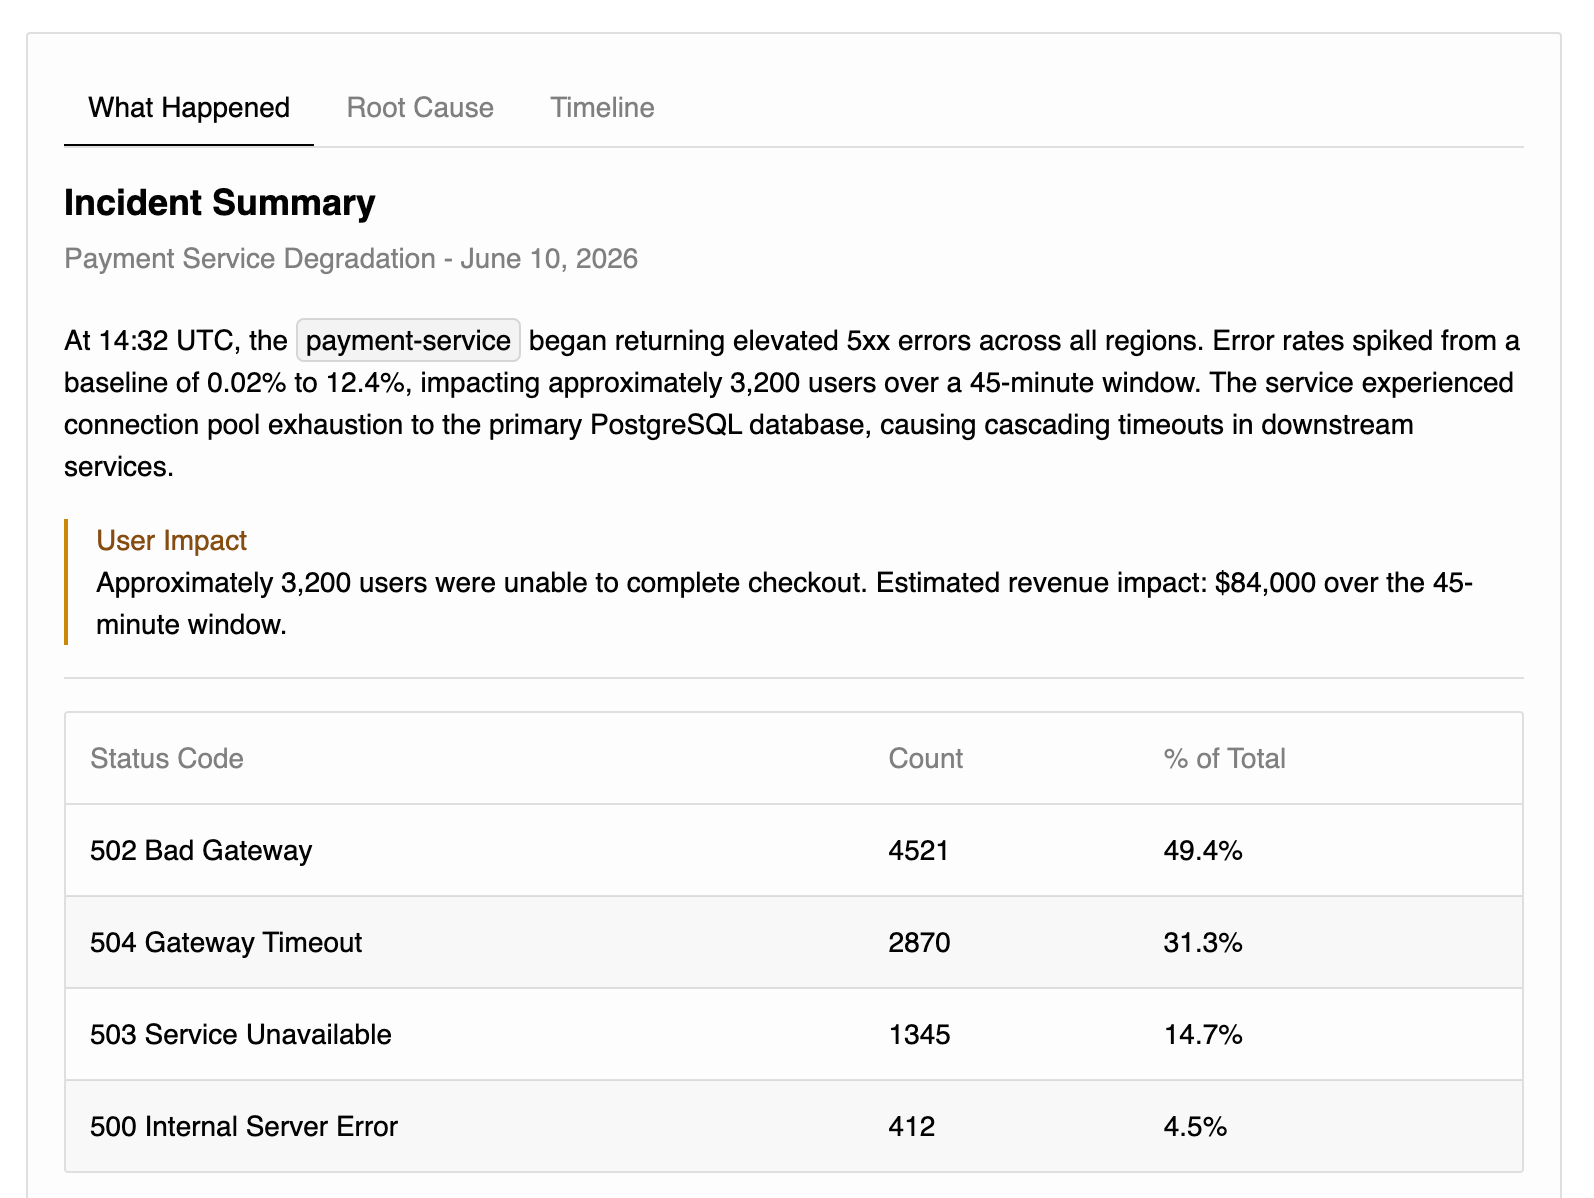
Want the AI to assemble an incident timeline from logs, metrics, deploy events, and traces? You can link to the ingredients, but not the meal.
Unfurling gave the AI a way to show evidence. It did not give the AI a way to compose a visual answer.
We needed the model to create UI.
Attempt 2: Make the AI write JSON
The next idea we had was to define a schema.
We built a custom artifact format called oodleui. The model would emit a fenced code block tagged oodleui, containing JSON that described the visualization. The frontend would parse it, validate it, and render React components.
Roughly:
```oodleui
{
  "type": "data_summary",
  "title": "Error Rate by Service",
  "blocks": [
    {
      "type": "hero_metric",
      "label": "Total Errors (24h)",
      "value": "12,847",
      "delta": "+23%",
      "delta_tone": "negative"
    },
    {
      "type": "metric_strip",
      "items": [
        {"label": "auth-service", "value": "4,231", "tone": "negative"},
        {"label": "api-gateway", "value": "3,102", "tone": "caution"},
        {"label": "payments", "value": "892", "tone": "neutral"}
      ]
    }
  ]
}
```
We defined our custom types - hero_metric, metric_strip, bullet_list, callout. A JSON schema went into every prompt so the model knew what it was allowed to emit.
The frontend parsed the JSON data LLMs returned, validated it against the schema, and rendered the right components.
It worked well enough for a prototype, but soon we started realising its limitations :
The prompt tax. The JSON schema bloated the model's context. And we had not even added charts yet. Bar, line, area, pie, axes, labels, colors, units: the schema was only going to get bigger.
The fragility. JSON validation caught bad artifacts, but it did not prevent the model from producing them. A missing comma, unclosed brace, or unsupported field name could turn the whole response into a render failure. Streaming made the failure mode worse: partial JSON is not renderable, so the UI had to wait for a
complete, valid object before showing anything useful.
The maintenance burden. Every new component meant touching the TypeScript types, JSON schema, prompt text, parser, and renderer. Contract drift was built into the design.
While looking out for better options, we came across OpenUI's post, "Stop Making AI Write JSON". It made so much sense as the next evolution from our approach.
Attempt 3: Let the Model Speak OpenUI Lang
From https://www.openui.com/docs/openui-lang:
OpenUI Lang is a compact, line-oriented language designed specifically for Large Language Models (LLMs) to generate user interfaces. It serves as a more efficient, predictable, and stream-friendly alternative to verbose formats like JSON. For the complete syntax reference, see the Language Specification
With oodleui json blocks, we pasted a JSON schema into the prompt and asked the model to emit JSON that matched it. With OpenUI, the prompt generated by the OpenUI library describes the available components.
export const artifactLibrary = createLibrary({
  root: 'Card',
  components: artifactComponents,
});

export function getArtifactPrompt(): string {
  return (
    artifactLibrary.prompt({ inlineMode: true })
  );
}
The model outputs a openui-lang snippet with the components provided to artifact library. The output is shorter than the equivalent JSON, easier to read. Each line is a complete statement - the renderer can parse and display components as tokens stream in, without waiting for a closing brace to validate the entire structure.
root = Card([header, chart])
header = CardHeader("Sample Bar Chart", "A bar chart with 3 data series")
chart = BarChart(["Jan", "Feb", "Mar", "Apr", "May"], [series1, series2, series3], "grouped", "Month", "Revenue (USD)")
series1 = Series("Product A", [12000, 15000, 13500, 17000, 19000])
series2 = Series("Product B", [8000, 9500, 11000, 10500, 12500])
series3 = Series("Product C", [5000, 6200, 7800, 8100, 9400])
With above snippet, Renderer produces a bar chart like below
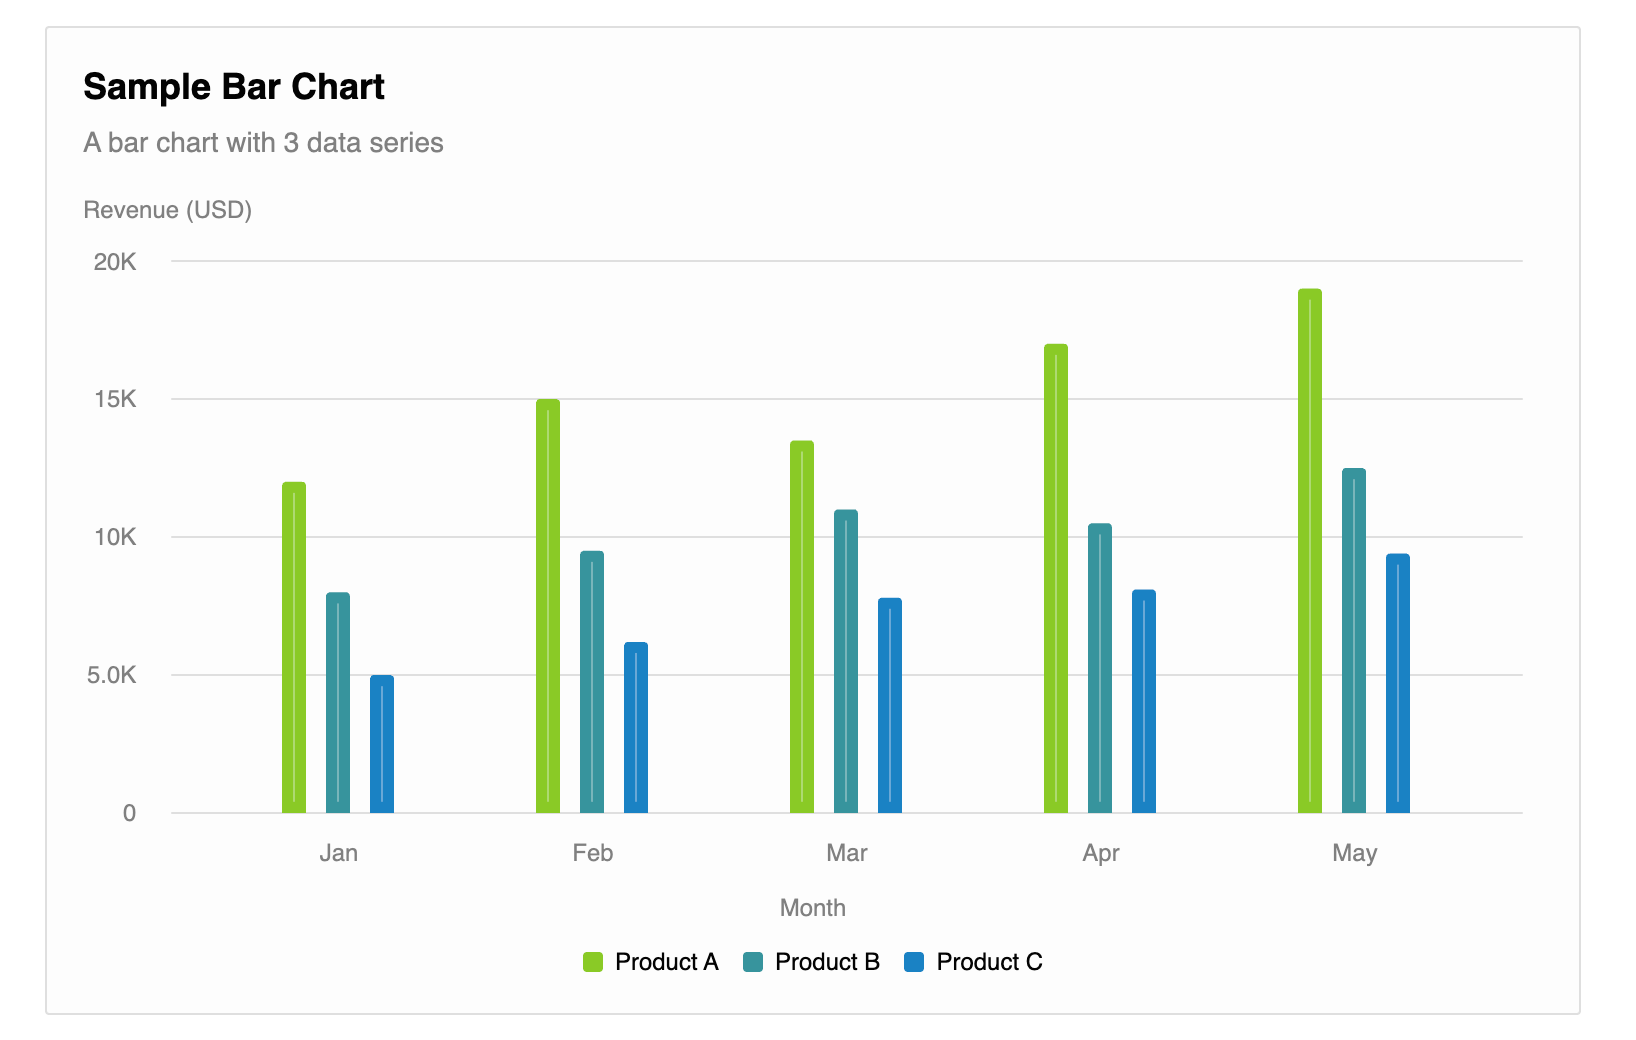
It also streams. The renderer shows components as tokens arrive. No waiting for the complete JSON before anything gets rendered on the UI.
We replaced the oodleui path, including the JSON schema definition, hand-written prompt builder, custom types, and bespoke renderer, and replaced it with OpenUI's defineComponent and createLibrary pattern.
Each component defines its own schema in code. The library generates the prompt. The renderer and schema live together. We added our custom components for Observability specific needs e.g. Timeline
What Actually Got Better
Streaming stopped being awkward. Rich responses now start appearing while the model is still writing. The user sees progress instead of a blank card waiting for valid JSON.
The prompt got smaller and harder to rot. OpenUI's generated component prompts are more compact than our hand-written JSON schema descriptions, and they stay in sync with the actual renderer. Prompt/schema/type drift stopped being a separate maintenance path.
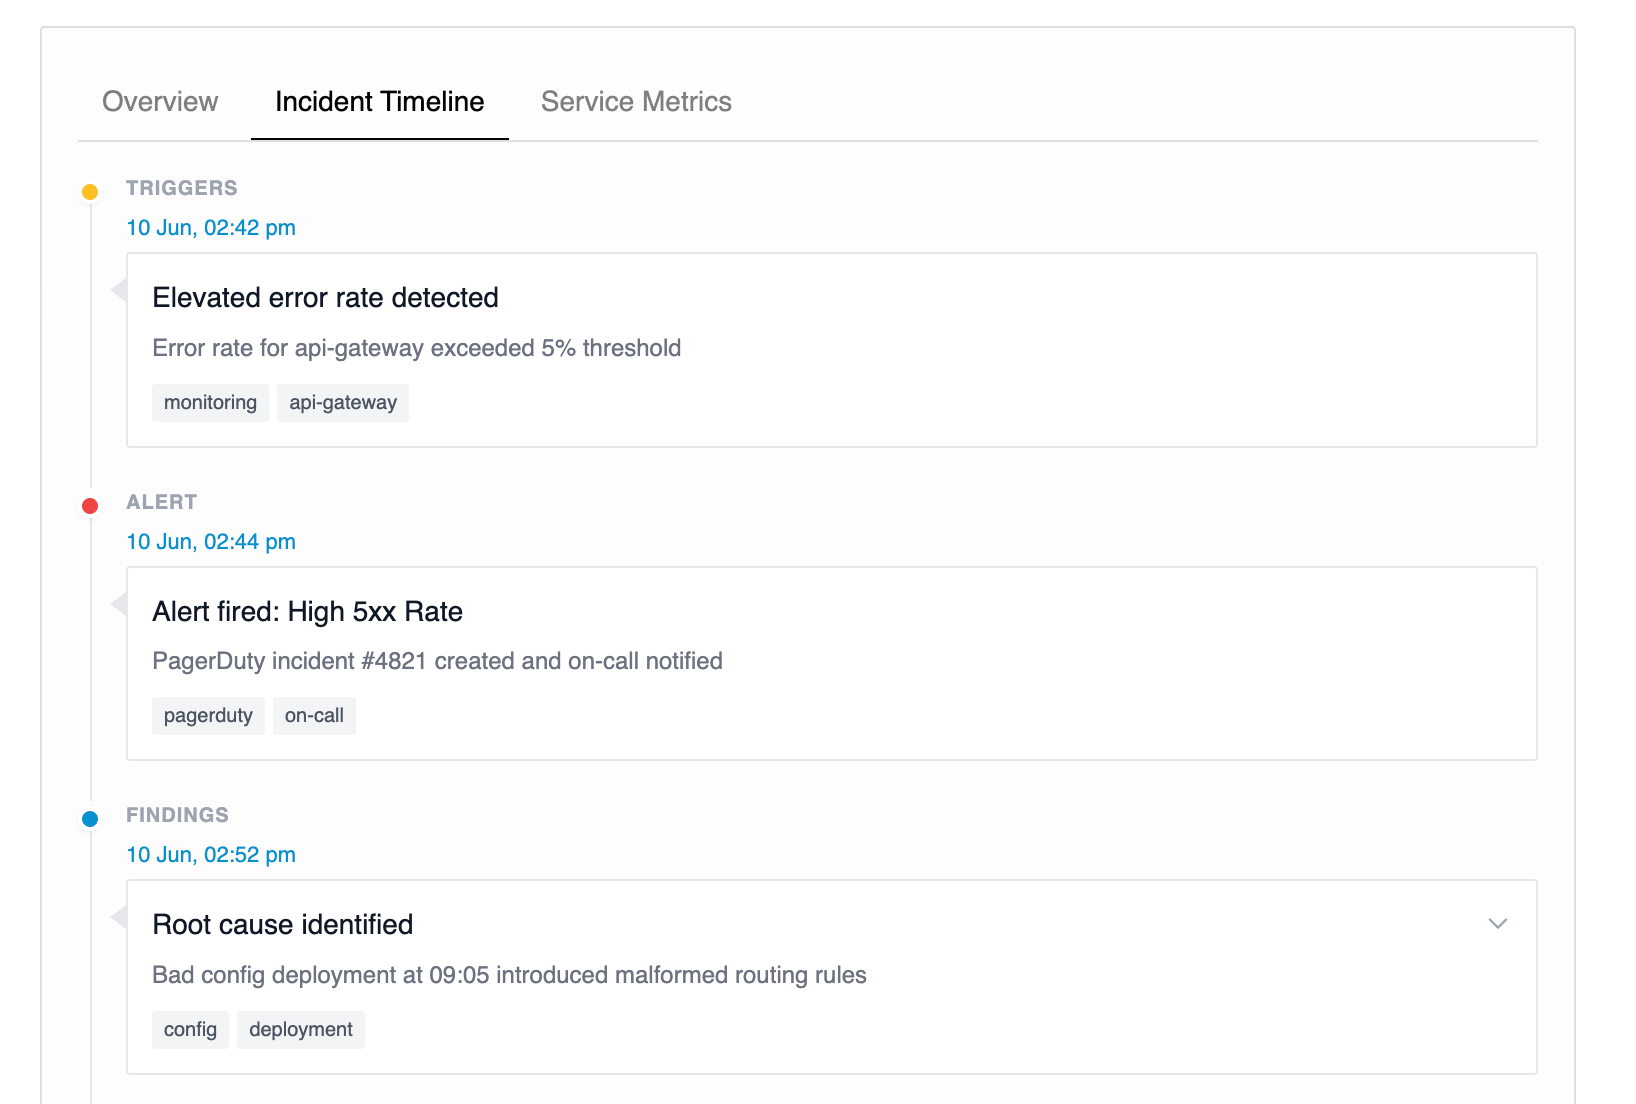
New components became cheap. When we needed timeline visualization for alert investigations, we added Timeline and TabGroup in a single PR. Later we added MetricChart and MetricDashboard for live Oodle metric panels, then TraceList and TraceDetail for traces. Each one followed the same defineComponent shape.
Dynamic UI became possible. Our JSON schema was a flat list of allowed block types. OpenUI's language is composable. Components reference other components by name, so the model can assemble layouts we never specifically designed for. A TabGroup containing a Card containing a BarChart just works, without us having to enumerate every valid combination in a schema.
The model made fewer weird mistakes. This is anecdotal, not a benchmark, but the model produces valid OpenUI Lang more reliably than it produced
valid JSON artifacts. That lines up with the OpenUI thesis: a line-oriented declarative format is closer to what the model handles well than a deeply nested JSON structure.
What We Learned
We built a custom JSON format because it felt like the responsible engineering choice. However, pair it with LLMs and streaming, and it shows its limitations. OpenUI showed a better interface by letting LLMs produce a constrained declarative text which works better in practice.
Or, as the OpenUI folks put it: stop making AI write JSON.
If you are building AI features into a product and fighting structured output formats, OpenUI is worth a look.
And if you want to see this inside an observability product, with metrics, logs, traces, charts, timelines, and the evidence behind them, try Oodle. You can experience the full product at our playground (no signup/login required).