How Oodle Keeps Observability Fast at Scale
Durable Storage. Elastic Queries.


If you've ever kept a giant observability cluster alive "just in case,"
you know the vibe: half your spend goes to idle capacity, and the other
half goes to hoping tonight's incident does not outgrow your sizing math.
Oodle takes a less dramatic approach. Keep data durable in object storage.
Bring compute to life only when someone actually asks a question.
That sentence sounds easy. Building it so it stays fast under real load is
the hard part. The rest of this post walks through how ingestion,
compaction, and query execution fit together in practice.
It focuses on metrics architecture. Logs and traces follow a
very similar design: separated storage/compute, elastic query paths, and
object-storage-backed durability.
Why a New Database Pattern?
Observability data behaves differently from general-purpose analytics data:
- It is immutable once written.
- Recent data matters disproportionately during incidents.
- Query load is spiky, not smooth.
- The same data often gets queried repeatedly.
- Even heavy queries are expected to feel real-time.
- Teams still need long retention windows with high fidelity.
That combination is why Oodle uses a different architecture shape: durable
object storage for retention, plus elastic compute for bursty read paths.
Why AI Changes the Scale Math
The shift toward AI is changing observability requirements in ways that compound on each other.
More telemetry per service. AI is being used to build features at record pace - which means more services being created, and more logs and metrics being generated. Adding more telemetry is now just a prompt away.
Burstier, more parallel queries. AI-assisted debugging tools — agents connected via MCP to Cursor or Claude, automated RCA pipelines — don't investigate the way a human does. A human opens a dashboard and follows one thread. An AI agent might test five hypotheses in parallel, each fanning out into multiple metric and log queries simultaneously. One investigation that used to be 3-4 queries becomes 15-20 concurrent requests hitting overlapping time ranges.
Longer retention windows matter more. AI model lifecycles span weeks or months. When inference latency regresses after a model update, teams need to correlate current behavior against training metrics and baseline performance from weeks ago. Aggressive downsampling — the traditional cost-control lever — destroys exactly the signal they need.
The net effect: the volume of data going in is growing, the volume and concurrency of queries coming out is growing, and the retention window those queries need to cover is growing. An architecture that couples storage cost to query capacity cannot keep up without over-provisioning.
Why is metrics data harder?
Most metrics show up every ~30 seconds, but not in one tidy stream per time
series. Ingestion is effectively round-robin across a huge number of series,
so each series gets scattered over time.
That creates three practical problems:
- You cannot rely on simple sequential-per-series write patterns.
- Compaction has to stitch interleaved fragments back into query-friendly
layouts. - Users still expect fast answers on very recent data while that stitching is
happening in the background.
This is why traditional databases struggle with this workload.
Quick Summary
TL;DR
- The core idea is separating storage from compute, not scaling one big
cluster forever.- On-demand fan-out (AWS Lambda) instead of waiting for
autoscaling to catch up.- Data stored in custom compacted formats so object storage can be both durable and query-friendly.
- Long retention without aggressive downsampling.
- Avoid sequential S3 call chains: where the next S3 fetch relies on data from the previous S3 fetch.
- If sequential data fetches are unavoidable, add caching to speed up sequential steps.
- AZ-aware ingestion and query paths for resilience.
- Designed for very high throughput (1B+ time series/hour).

The Bet: Store Forever, Compute on Demand
Observability data has two very different characteristics:
- Retention windows are long.
- Queries spike unpredictably (deploys, incidents, audits, AI agents
testing multiple hypotheses at once).
When those are tightly coupled in one always-on cluster, you end up paying
for peak query behavior all day, every day. Oodle splits the problem:
- Storage layer: object storage (S3) for durability and economics.
- Query Compute layer: serverless query execution for burst tolerance.
- Query layer: routing + caching so not every request starts
cold.
Less heroic capacity planning. Fewer "why is this cluster still this big"
meetings.
Ingestion: Fast Writes, Calm System
Ingester accepts open protocols like Prometheus Remote Write and OTLP, then
batches and flushes data into Write-Ahead Log (WAL) objects in object storage.
The important part is not the S3 checkbox. It is the write behavior:
- Periodic and pressure-based flushes keep hot paths from stalling.
- Early partitioning lowers downstream merge work.
- Metadata updates make new objects quickly discoverable.
- Late-arriving data is handled without polluting fast recent-query paths.
This is what "designed for object storage" looks like versus "supports
object storage if you squint."
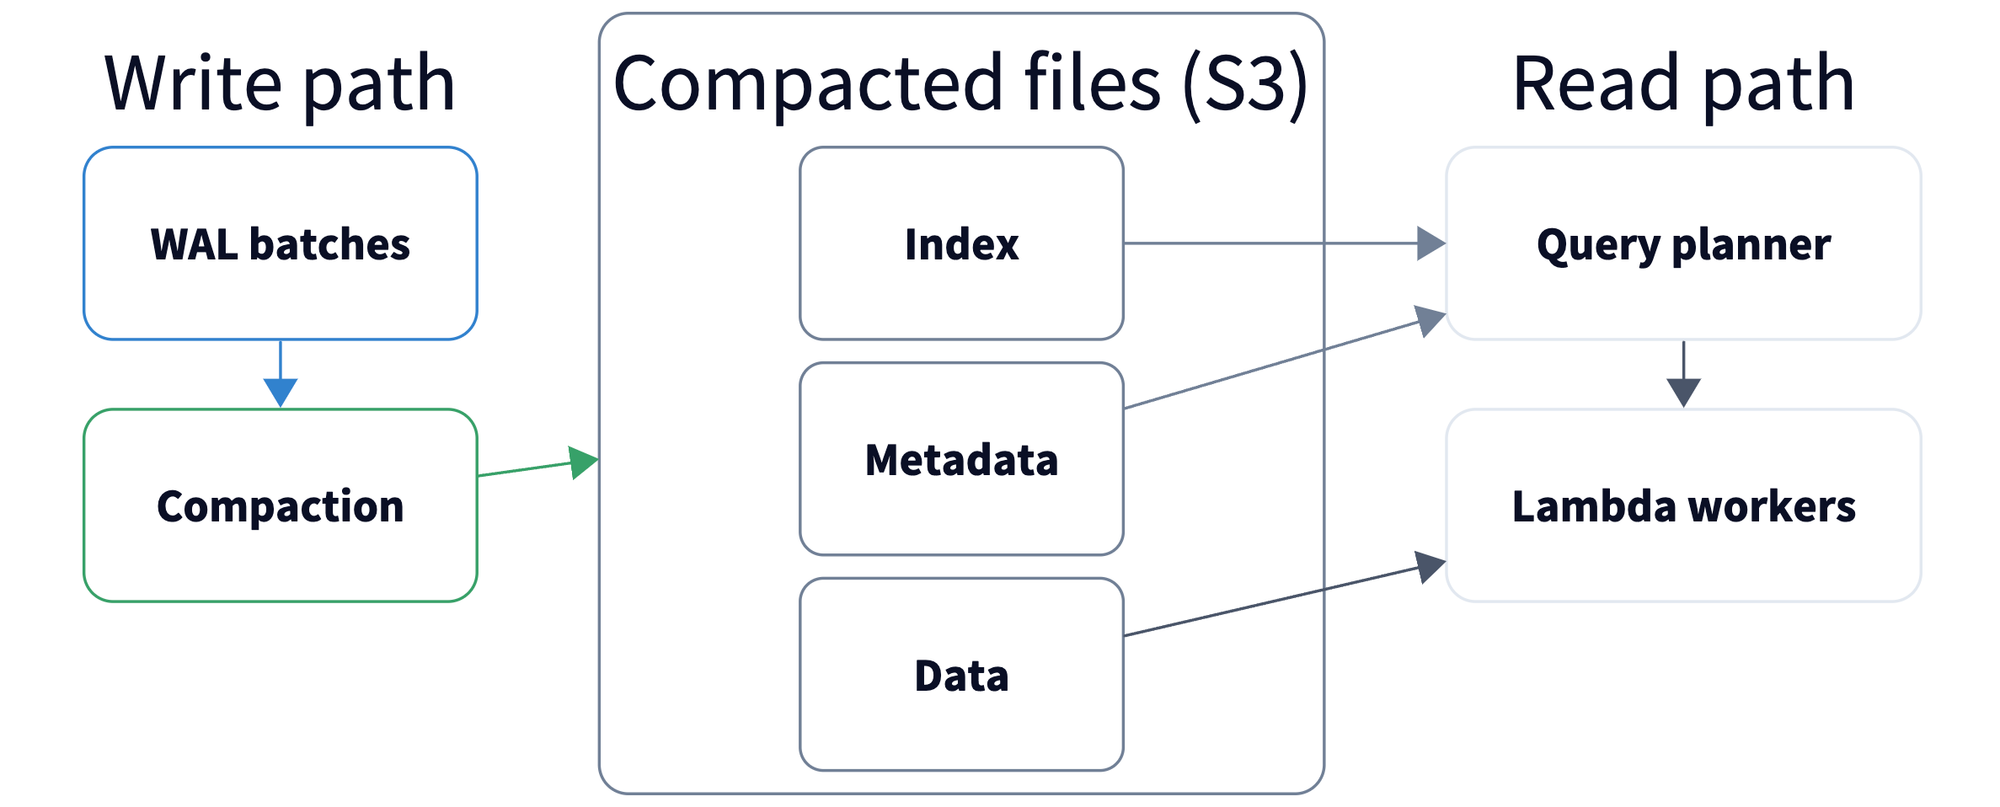
Compaction: Turning Raw Streams Into Useful Files
Raw WAL writes are cheap and simple. Querying raw WAL at scale is neither.
Compaction is where Oodle turns write-friendly data into read-friendly
artifacts:
- Merge and de-duplicate overlapping time-series windows.
- Write compacted data/index files with metadata trailers.
- Tombstone and clean up superseded objects in background flows.
Result: less data fetched, less data decoded, faster answers.
Blazer: The Recent-Data Fast Lane
Compaction is not instantaneous, and incidents rarely wait politely.
So for the freshest window, Oodle leans on blazer:
- It keeps recent WAL-backed data in memory for fast queries.
- As compaction produces hourly compacted/index files, Blazer drops those in-memory segments after the recent-data window (about 30 minutes).
- This bridge matters because WAL data for a series is spread across many files; Blazer merges fragments for the same series and keeps them queryable until compaction rewrites them into read-friendly compacted layouts.
- Query paths can fall back to HA replicas when a primary Blazer node fails before returning data.
Net effect: recent data stays fast now, without waiting for every background
compaction step to finish.
The Useful Nerdy Details
Pretty architecture diagrams are nice, but low query latency comes
from file-format choices:
- Metric-name-sorted data blocks improve selective reads.
- Trailer metadata allows targeted metadata fetches without reading full files.
- Compressed metadata + dictionary encoding caches cut repeated decode work.
- Column chunk-level skipping let the query engine skip irrelevant chunks based on the query without decoding them.
- Time-series-friendly encoding reduces bytes scanned per query.
These details are why object storage behaves like an active query substrate,
not a cold archive you grudgingly query.
Two lessons we learnt the hard way:
- Serial S3 reads make queries slow. We read many file blocks in parallel
(with limits) instead of one request at a time. - Tiny S3 fetches add up fast. We use range reads, and we cache tiny
metadata needed to read files (like trailer/footer/index hints), to avoid
repeated small calls and decode work.
File Format Choices That Pay Off
Some of the biggest wins are in how compacted files are written:
The design takes practical inspiration from both Prometheus TSDB layout ideas
and Parquet's columnar principles, adapted for observability query patterns.
- Files are deliberately bounded. Compaction rolls output files at target sizes (for metrics, around 128 MB) so reads stay chunkable and parallelizable instead of creating giant monolith files.
- Data and metadata are split on purpose. The data file is uploaded first, then a compact metadata file with trailer info; because metadata files are small, planners can often fetch what they need in a single S3 call instead of touching full data files.
- Each file is indexed with read-critical hints. The index keeps records of all metadata files and where each compacted file starts, plus file sizes and trailer size, so the query path can quickly prune data and metadata files required to serve a query.
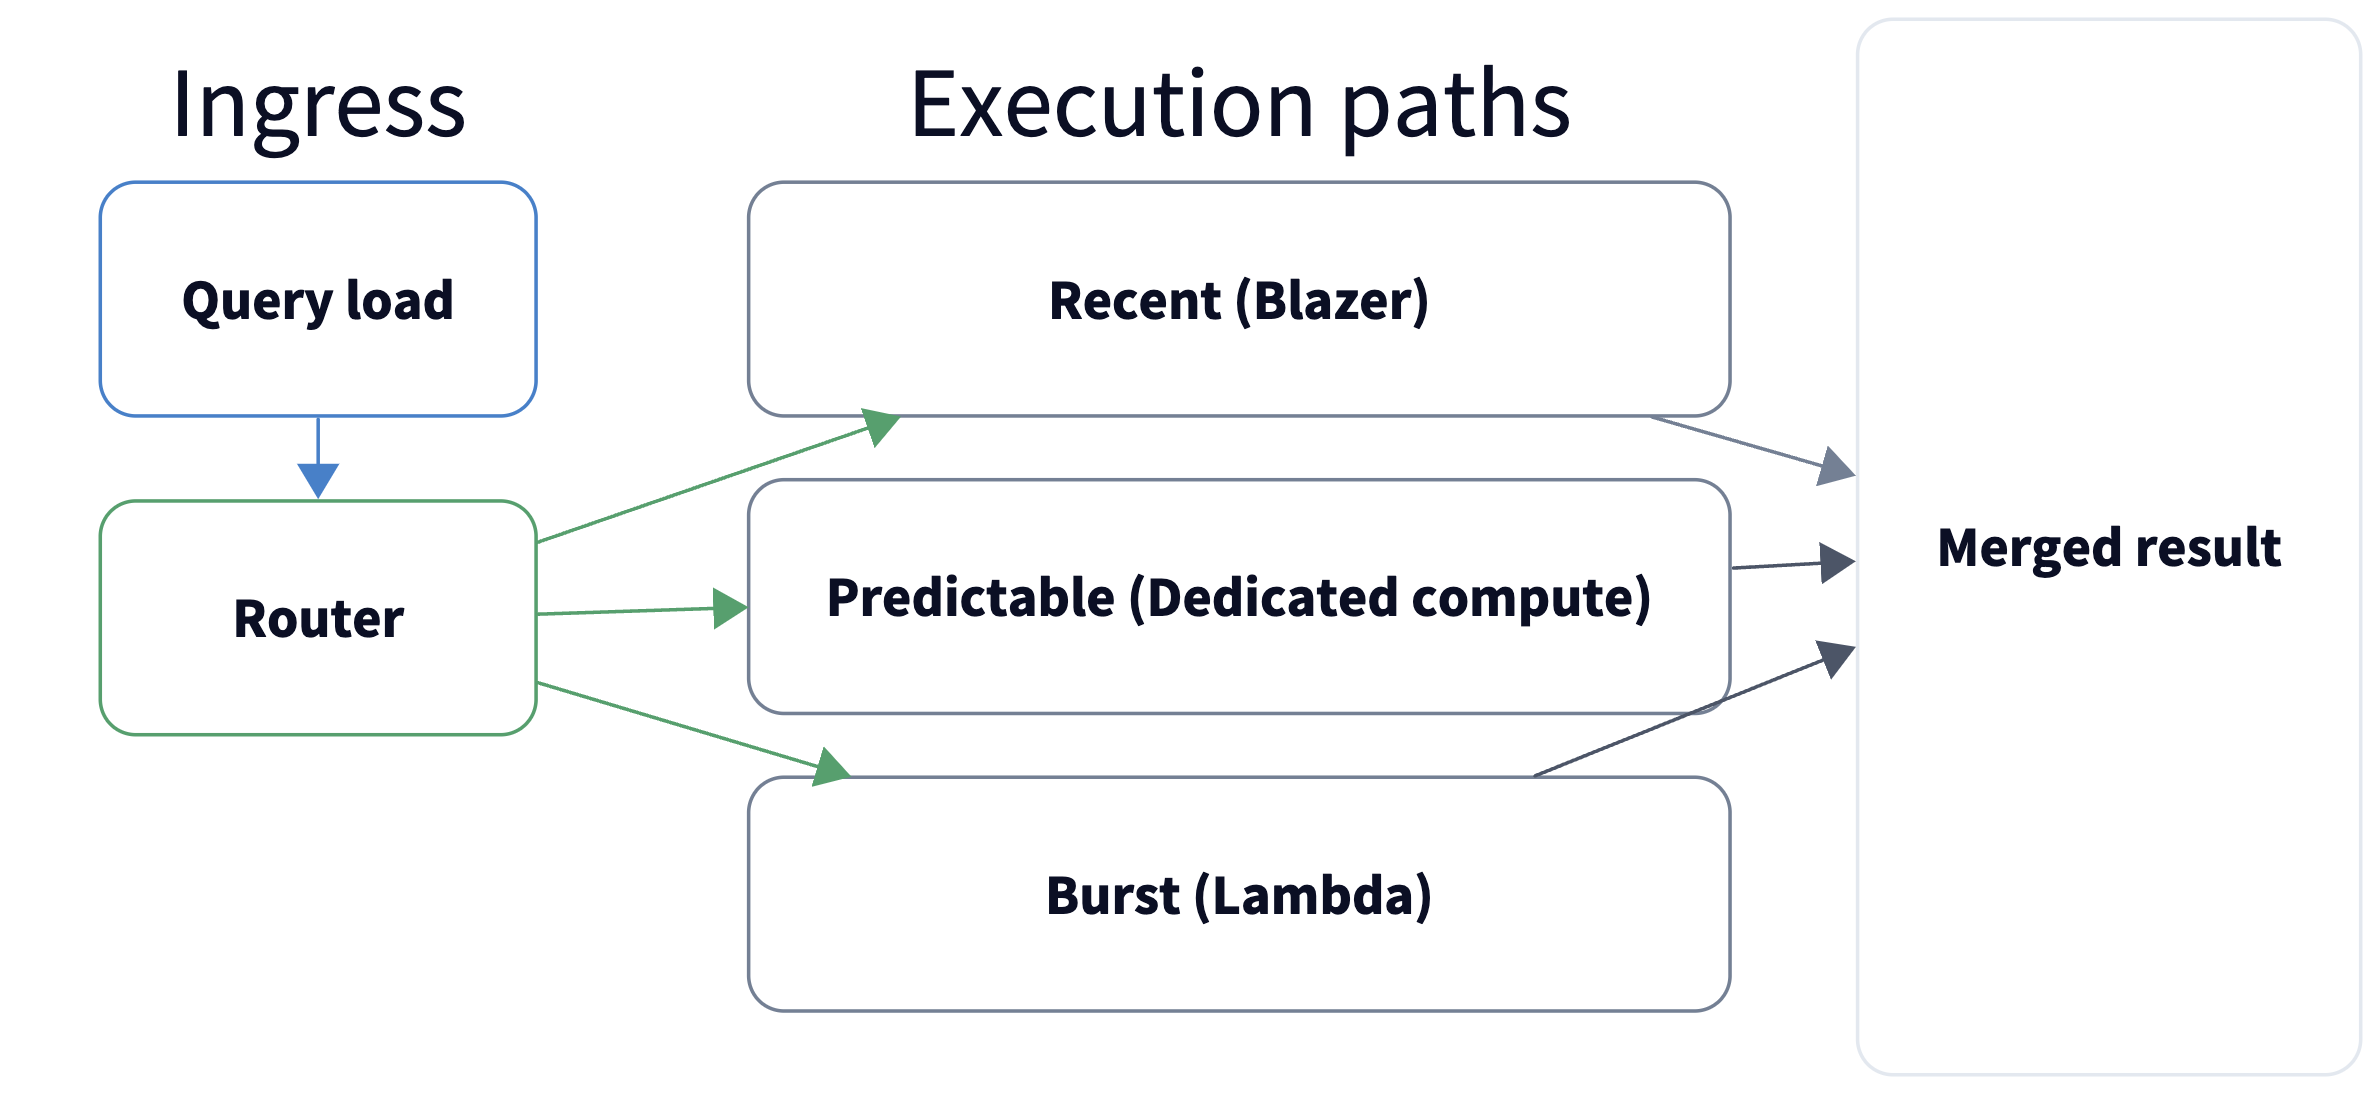
Query Path: Burst When Needed, Gone When Not
The query layer routes by freshness, file eligibility, and path health.
Predictable query load runs on dedicated compute, while burst traffic fans
out across serverless workers (AWS Lambda). Mixed-freshness queries can
follow alternate paths.
Why this matters:
- Incidents are bursty. Query volume can spike fast.
- AI makes bursts burstier. One investigation can fan out into many
parallel queries. - Cost stays proportional. Baseline traffic uses right-sized dedicated
compute, and spikes use on-demand Lambda fan-out. You don't pay for an oversized fleet. - Long-range queries stay fast. Time windows are split and processed in
parallel across Lambda workers instead of waiting on one large serial scan.
Compared with autoscaling node pools, serverless fan-out skips the awkward
lag between "traffic spike started" and "new capacity finally arrived."
Another win: query workers keep hot object data close, so repeated
investigations don't keep bouncing back to S3.
Columnar PromQL Engine Benefits
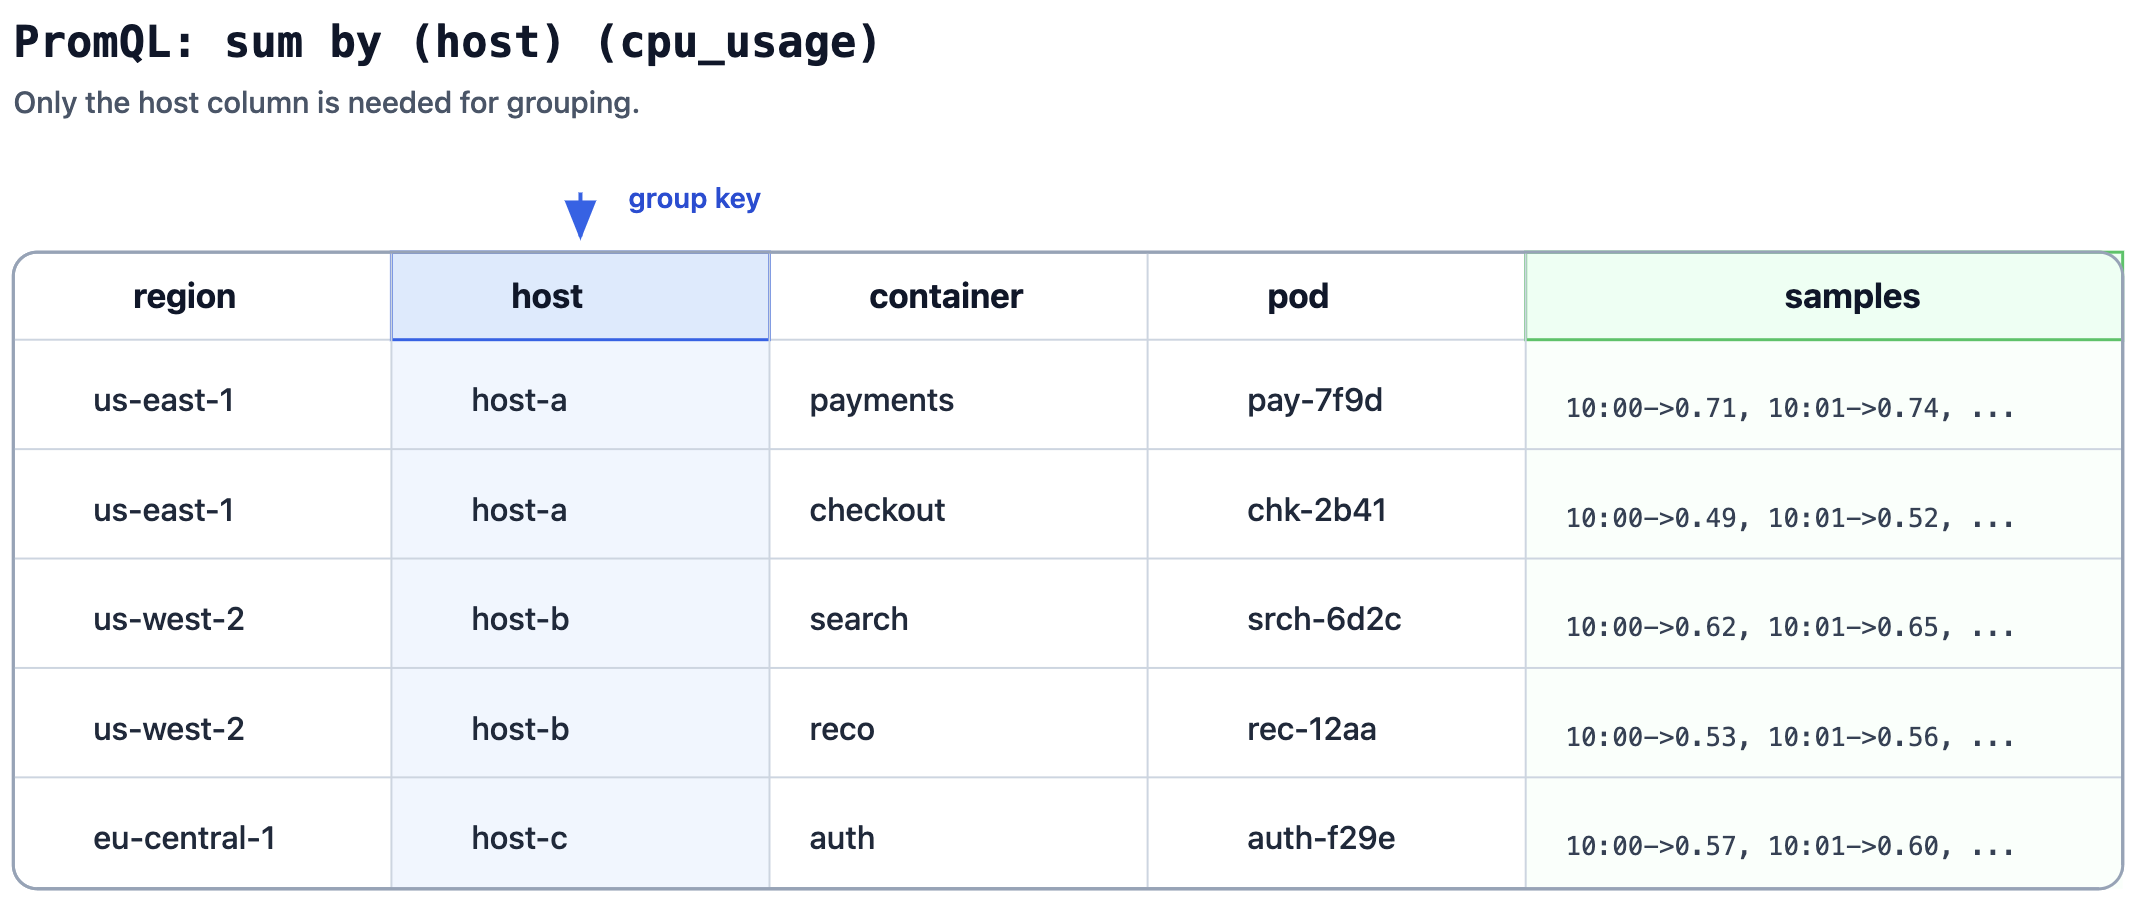
Oodle uses a columnar PromQL engine on top of column-oriented compacted files.
That pairing gives a few practical wins:
- Read less data per query. PromQL operations can pull only the needed label/value/time columns instead of scanning full row payloads.
- Faster filter + aggregate paths. Columnar access patterns align well with common PromQL workloads (label filtering, range aggregates, grouped math).
- Better long-range efficiency. Combined with Lambda fan-out, the engine can process wide time windows in parallel while keeping bytes scanned lower.
- Lower memory pressure. Working column-by-column reduces decode churn compared with materializing full rows too early.
Reliability and Ecosystem Fit
A few platform details matter a lot in day-2 reality:
- Durable storage model: object storage durability characteristics
reduce corruption/loss risk versus local replicated SSD assumptions. - AZ-aware design: ingestion and query paths are tuned to reduce
cross-AZ overhead and improve resilience. - Open integrations: OTLP and Prometheus Remote Write fit existing
pipelines and Grafana workflows. - High scale target: architecture is designed for very high
throughput (documented at 1B+ time series/hour).
What Teams Actually Feel
For engineering teams, this architecture changes the lived experience:
- Less storage-cluster babysitting.
- Better retention economics without aggressive downsampling games.
- Better behavior under unpredictable query concurrency.
- Faster path from telemetry ingestion to usable answers.
If your observability stack still feels like a database fleet with a pager
attached, this is the shift: durability in cheap object storage, performance
from smart formats plus elastic compute.
References: