How Labra engineers stopped getting logged out mid-debug
... and unified fragmented multi-cloud observability with Oodle

Summary
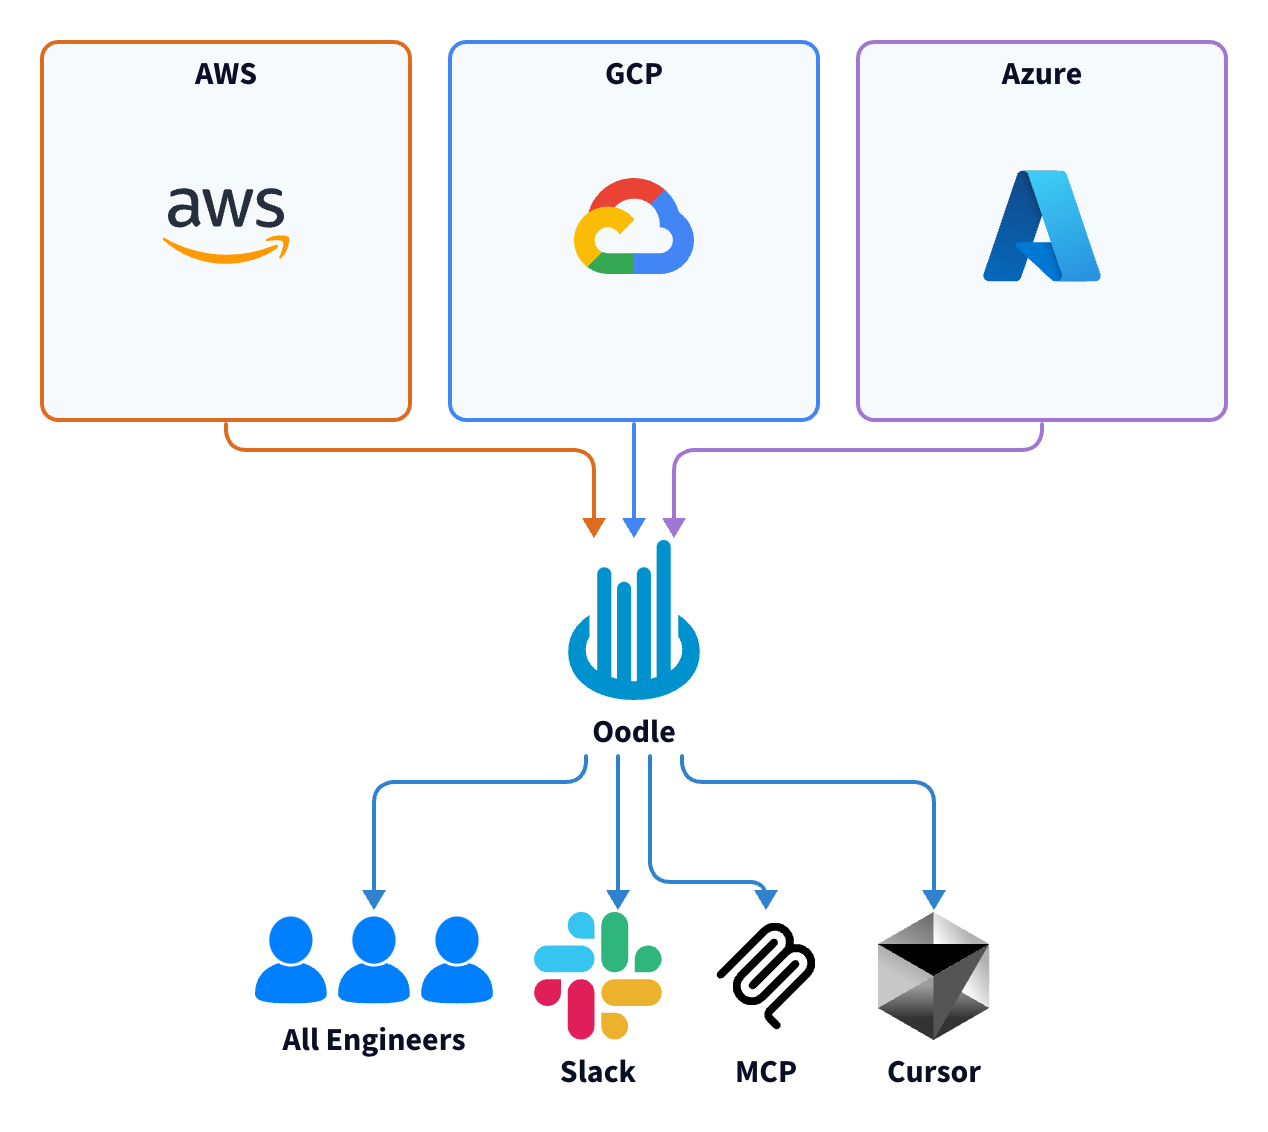
Labra runs a multi-cloud SaaS platform across AWS, Azure, and GCP. Their observability was split between New Relic and cloud-provider specific tools: twice the cost, four times the number of tools to monitor.
Challenges:
- Observability access limited by pricing tiers and product complexity
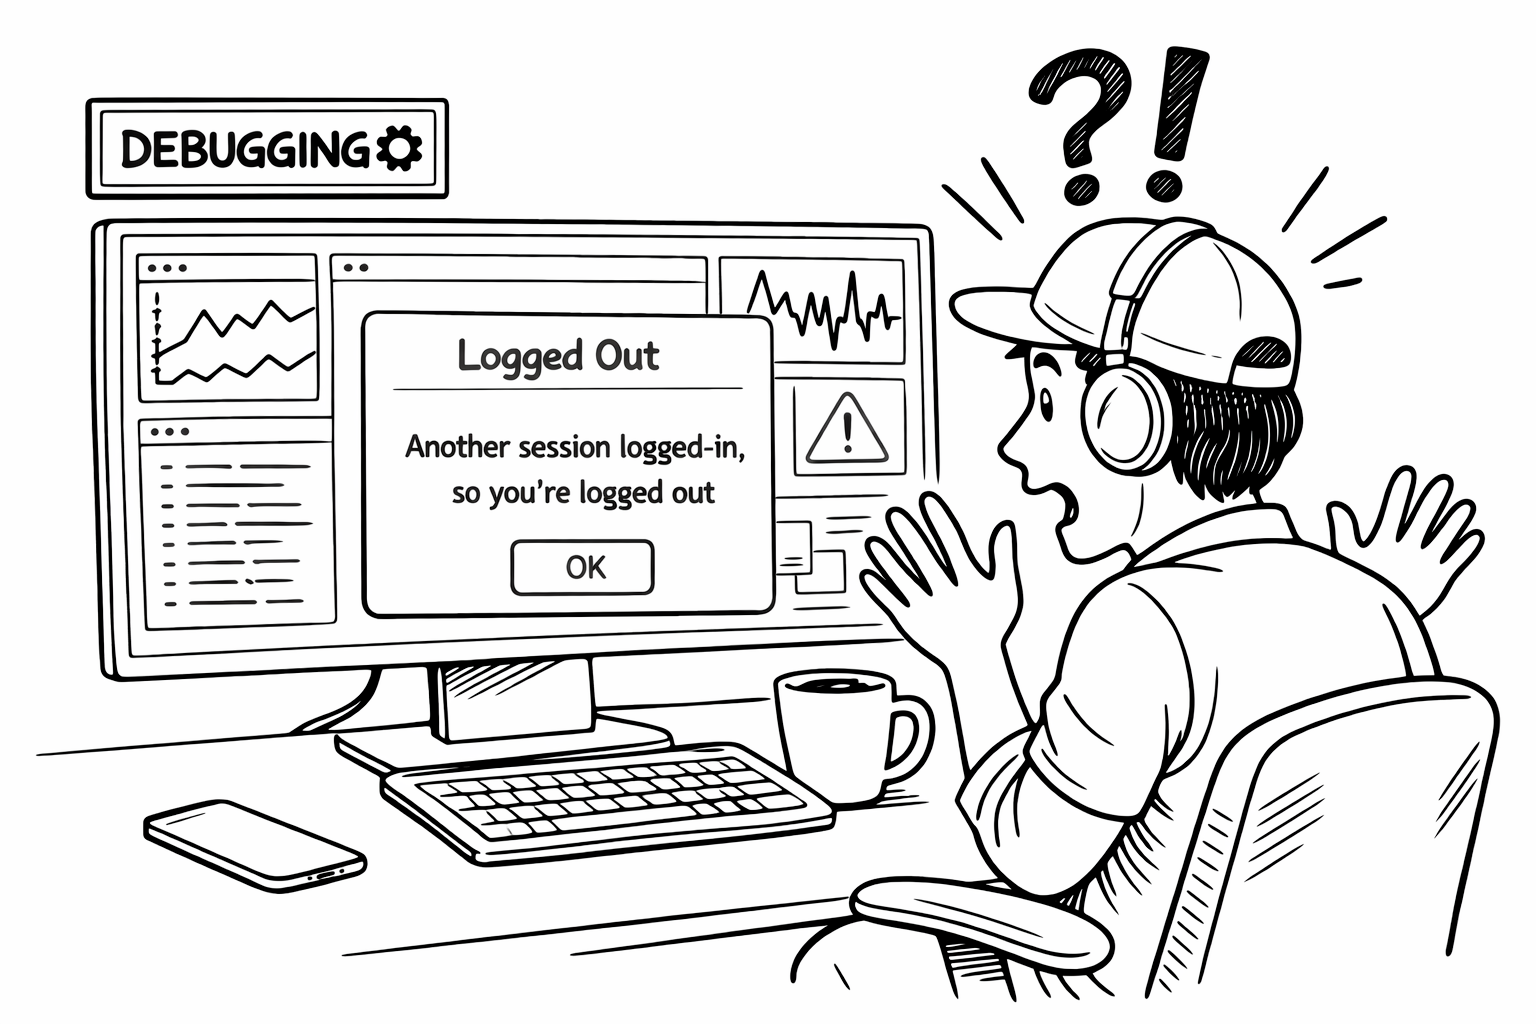
- Expensive per-user pricing. Account-sharing leads to engineers
getting logged-out mid-debug. - "New Relic has a ton of features we can't use: they're not simple"
- Expensive per-user pricing. Account-sharing leads to engineers
- Double-paying: CloudWatch and New Relic ingesting the same data
- Alerting was noisy, delayed, or absent entirely
- Azure logs took five minutes to appear
- Distributed tracing was manual and incomplete
With Oodle:
- Unified observability for all signals: logs, metrics, traces.
- Ask AI Assistant in plain English to debug across all signals.
- Powerful features, simple UX.
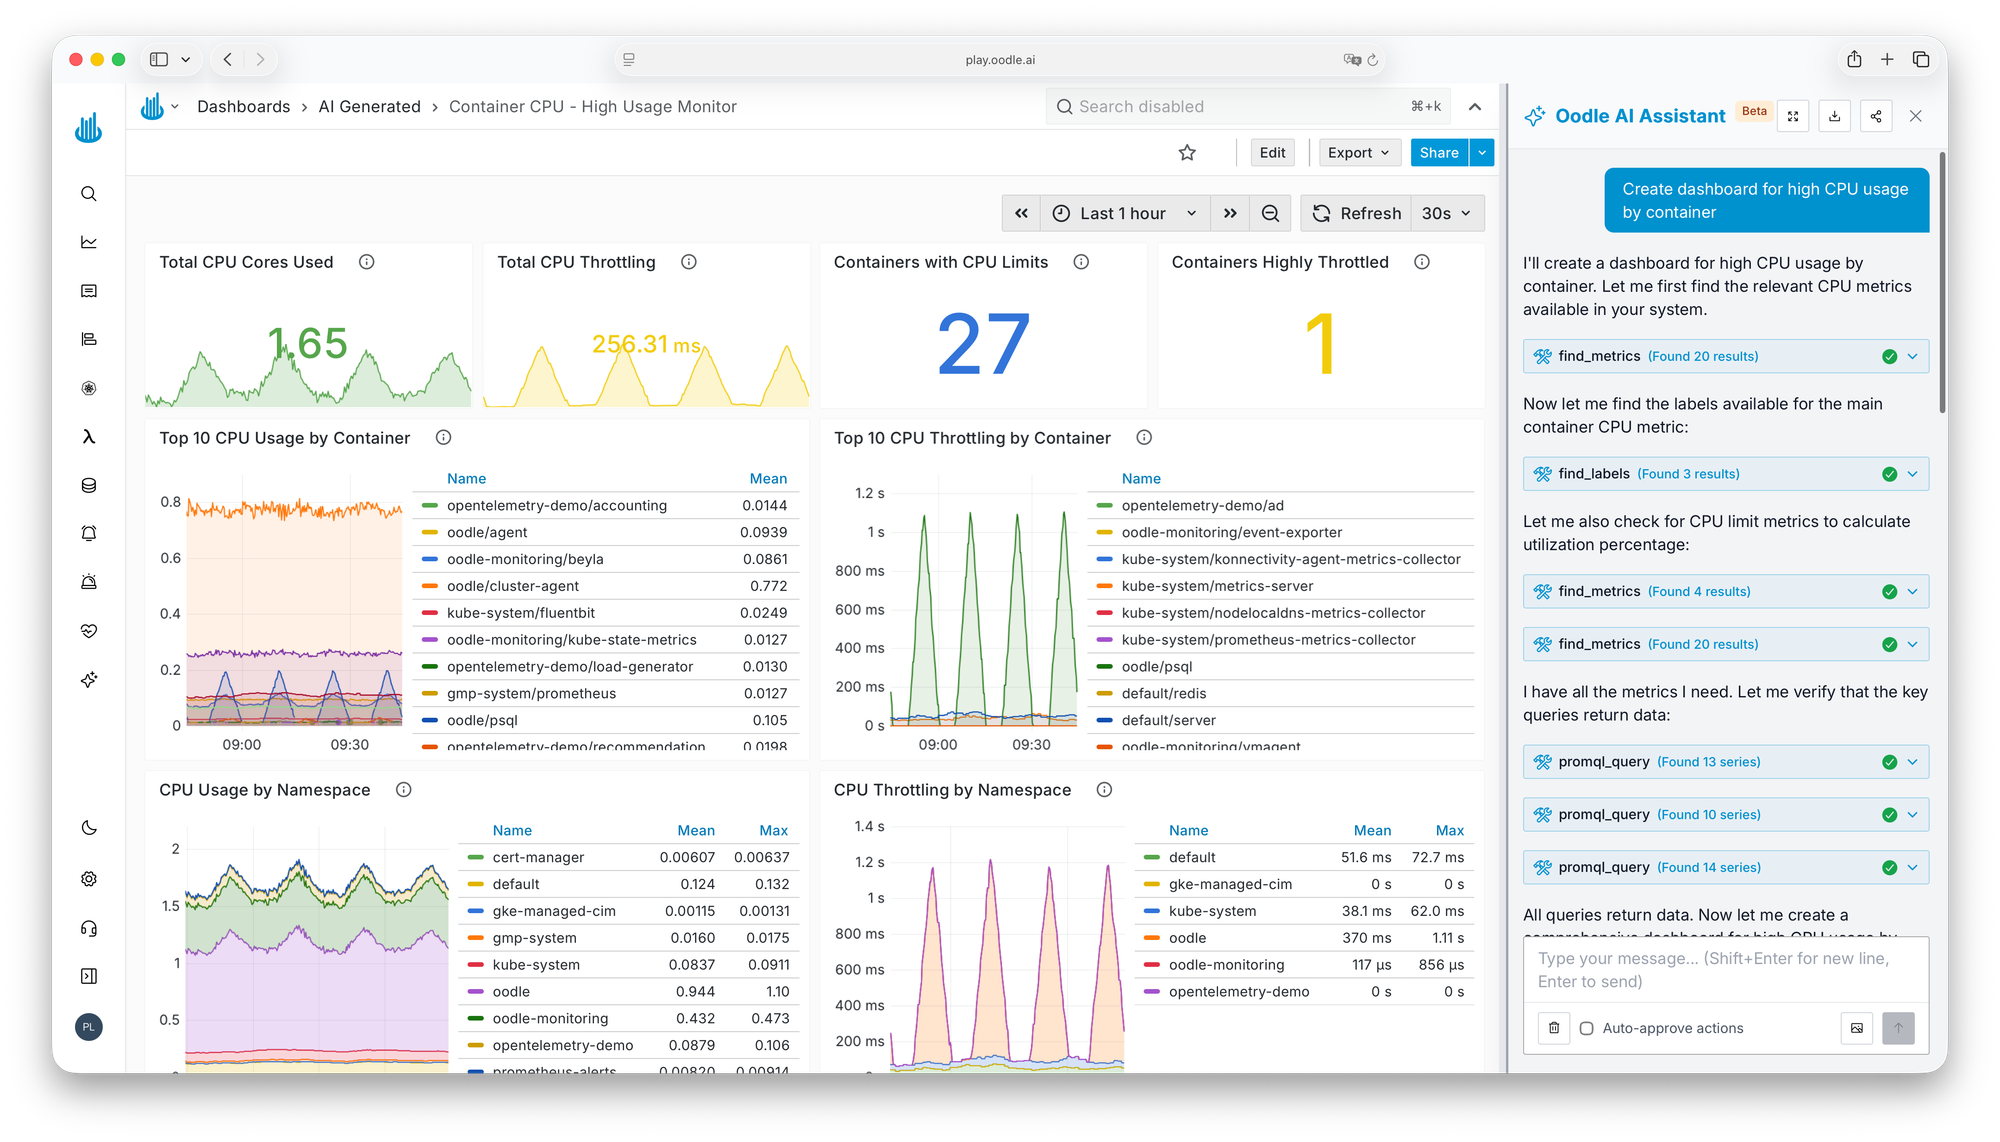
- AI assistant built a 50-panel dashboard in 1.5 hours (vs 1.5 days manually)
- MCP server plugged into Labra's custom LangChain debugging agent.
We've been struggling a lot with monitoring, alerting. We have the tools. It's just not much time or expertise put towards that part.
Nestor
Principal Engineer, Labra
Who Is Labra
Labra is a SaaS go-to-market platform that helps independent software vendors list, sell, and operate through cloud marketplaces on AWS, Azure, and GCP. The platform orchestrates everything from CRM integration to marketplace transactions for enterprise Independent Software Vendors.
Over 40 developers run roughly 20 services across four environments (QA, staging, production, DR). AWS usage has ECS Fargate, Lambda, RDS, DynamoDB. Container Apps, Azure Functions, Cosmos DB are used on Azure, and GCP uses GKE and Google Cloud Functions. The stack is primarily Python, with some Node.js and a critical Golang service.
For a team processing marketplace transactions across three clouds, observability isn't optional. When a listing sync fails or a transaction gets stuck, engineers need to trace it through Lambda functions, ECS services, and third-party APIs. Fast.
Paying Twice, Debugging Twice
Labra's observability had grown organically. CloudWatch was the default for AWS: ECS logs, Lambda logs, infrastructure metrics. But CloudWatch alone wasn't enough for a team that needed APM, error tracking, and distributed tracing. So they added New Relic.

The intent was to consolidate. The opposite happened. New Relic had reliability problems, and the team couldn't afford gaps in log availability. So they kept both.
We wanted to have high availability of logs. We were worried about downtime, so we stored logs in both places, CloudWatch and New Relic. But now, going forward, we'd love to see it in one place only.
Priyank Raj
Senior Software Engineer, Labra
ECS services shipped logs to both CloudWatch and New Relic. Lambda logs went to CloudWatch first, then got forwarded to New Relic through a separate pipeline. Two tools ingesting the same data. Two bills every month.
New Relic had the capabilities. The team just couldn't use them. Alert configuration was complex enough that monitors were either misconfigured, noisy, or not set up at all. Dead letter queue notifications fired for internal test accounts. Critical alerts never got created because nobody had the time.
Since alert creation in Oodle was much easier, the team had created all the alerts they need right away, including the ones they always wanted on New Relic but were putting it off.
We're not utilizing New Relic to its full capability. The main point is we're not getting alerts properly.
Nishant Kumar
Senior Software Engineer, Labra
The cost kept climbing. Per-user pricing meant one admin account with three concurrent logins for the entire company. A fourth engineer logging in would kick someone out mid-debug. Everyone else relied on CloudWatch or secondhand Slack summaries.
New Relic is very expensive, so we have just a few users. Only three can log in at a time. If a fourth person logs in while you are debugging, you get logged out in the middle.
Priyank Raj
Senior Software Engineer, Labra
On Azure, logs took five minutes to surface. For a team debugging production issues across clouds, five minutes is an eternity.
The logs on Azure take like five minutes to show up, and that is painful
Nestor
Principal Engineer, Labra
Distributed tracing existed, but barely. The team had instrumented some services with New Relic's proprietary SDK. Gaps were common. Tracing across clouds didn't work. And because the instrumentation was tied to New Relic's SDK rather than OpenTelemetry, any future vendor change would mean re-instrumenting everything.
The wish list was clear: one platform for logs, metrics, and traces. Alerting that works without a week of configuration. No per-user fees. And support that responds immediately.
Why Oodle
Four things stood out during the initial evaluation.
The UI made sense immediately. Priyank, who leads Labra's platform engineering, had spent enough time in New Relic had many complaints. Oodle was the opposite.
The UI is simpler here and easier to debug. In New Relic, it's clumsy. At least for me, it's very difficult to navigate. But here, everything is straightforward. You don't need to drill down deep.
Priyank Raj
Senior Software Engineer, Labra
AI: built-in, not bolted-on. Oodle's AI assistant creates alerts, writes PromQL, builds entire dashboards, and investigates firing alerts by correlating logs and metrics.
For a team that had given up on configuring New Relic's alerting, this tipped the evaluation.
We use the Oodle AI assistant like this: this is my service, this is my request ID, get me the RCA. It comes with artifacts and saves a lot of time.
Priyank Raj
Senior Software Engineer, Labra
No per-user fees. Oodle charges by ingestion volume and retention. Every developer gets access. For a team where 40+ engineers shared three New Relic logins, this was liberating.
Rapid-response support. Responsiveness is a trust signal when you're evaluating a newer vendor. The Oodle team answered questions quickly, shipped features during the PoC, and worked alongside Labra's engineers on integration. With Oodle University tutorials and Slack support, the Labra DevOps team handled integrations with ease.
Support on Slack is very good. We get replies in minutes.
Priyank Raj
Senior Software Engineer, Labra
From PoC to Production in Days
The PoC started small: three QA ECS services, connected via an OpenTelemetry collector running as a sidecar container. Logs and traces started flowing immediately.
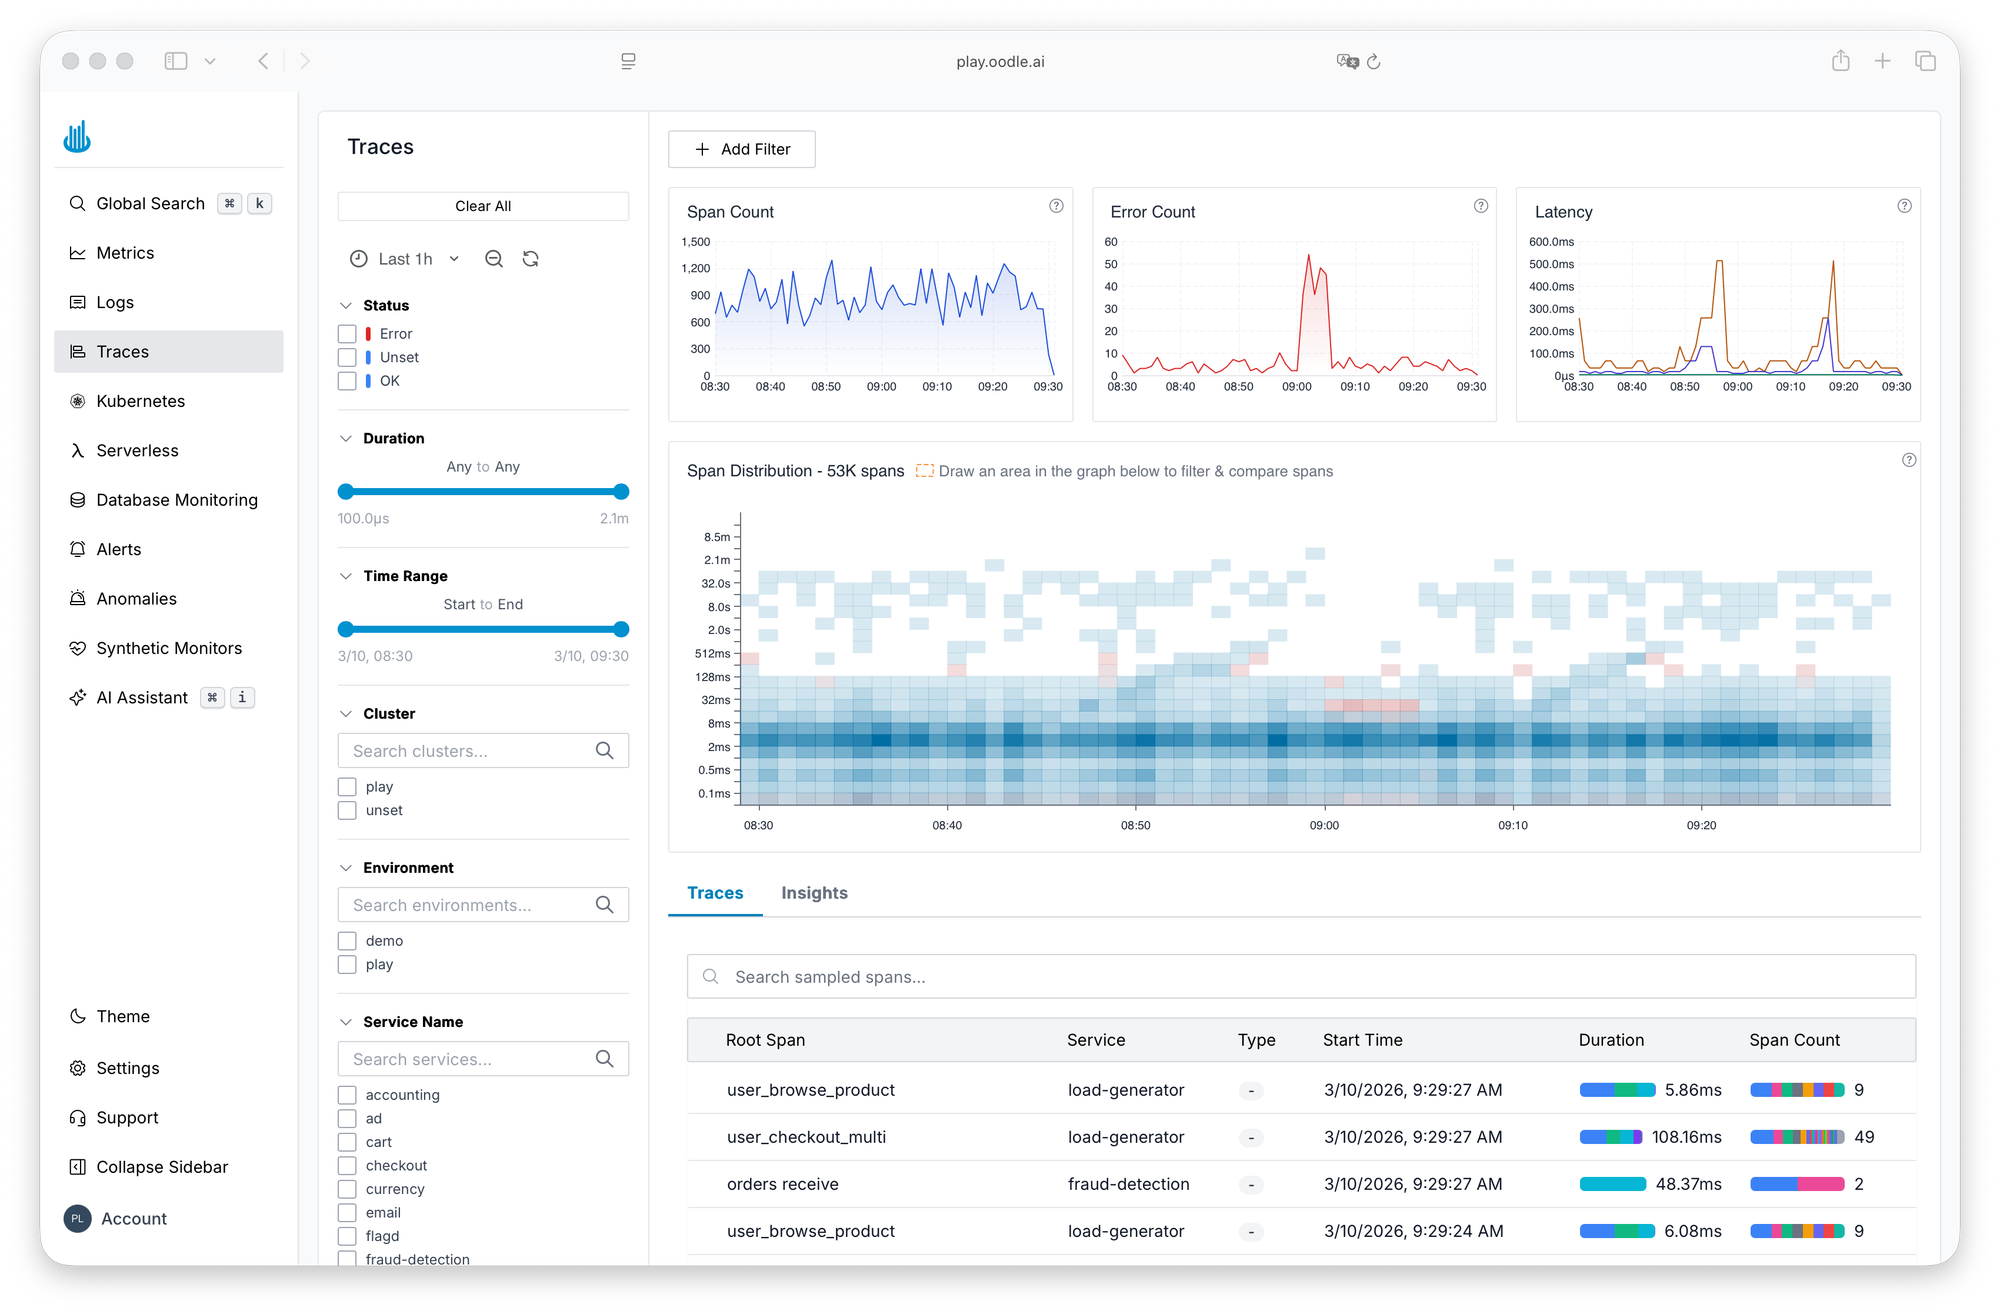
Log ingestion was seamless. Just connecting with the OTel collector and things are flowing good. The best part I liked about the platform is tracing, that heatmap. It really helps.
Shashwat
Lead Software Engineer, Labra
Looking at how quick and easy the hyper-focused POC process was, the team expanded to production within the first week. The integration was, in Priyank's words, "straightforward". They added the OTel collector sidecar to existing ECS task definitions. Production telemetry started flowing without application code changes.
Alert creation followed. The DevOps team set up monitors for ALB error rates using Oodle's AI assistant. No PromQL expertise required.
I did not face any challenges on the alert creation part. It's good!
Swapna Mannem
Senior DevOps Engineer, Labra
Oodle's AWS integration pulled in CloudWatch metrics for RDS, ALB, ECS, ElastiCache, and SQS. Infrastructure metrics from EC2 instances came through a Datadog agent forwarding to Oodle. Within two weeks, the team had logs, metrics, traces, and alerts running in both QA and production.
Support showed up when it mattered. When a developer hit a Python logging compatibility issue (structlog didn't work with OTel's auto-instrumentation), an Oodle engineer sent back a verified, working code example within minutes.
The New World with Oodle
One Platform, Every Developer
No more choosing between CloudWatch and New Relic depending on which service you're debugging or whether you have a seat. Every developer at Labra now has access to the same logs, metrics, and traces. No per-user fees. No seat restrictions. No secondhand Slack summaries.
Within a week, 10-15 developers were using Oodle for real debugging on migrated services: searching logs by request ID, tracing requests across services, building dashboards for marketplace transaction metrics. After one production deployment, a developer found the root cause in Oodle's AI summary at the top of the log view instead of scrolling through hundreds of log lines. Alerts were firing to Slack. This wasn't a sandbox evaluation. It was production work.
AI That Debugs, Not Just Alerts
Oodle's AI assistant replaced the manual alerting workflow. Instead of constructing PromQL queries and hoping the threshold was right, the team describes what they want monitored. The assistant creates the alert, catches syntax errors, and suggests improvements.
Labra took it further. The team had already built a custom LangChain agent for internal debugging. They connected Oodle's MCP server to this agent.
When alerts are triggered, the agent uses the MCP and gets artifacts out of it. The MCP had minimum delays.
Priyank Raj
Senior Software Engineer, Labra
They had tried the same approach with New Relic's MCP and AWS CloudWatch's MCP. Neither performed well. Oodle's was faster and returned useful results consistently.
Dashboard building got faster too. Priyank built a 20-panel monitoring dashboard in an hour and a half with the AI assistant. The same work done manually — find each metric, write the PromQL, verify the graph, repeat 20 times — would have taken a day and a half.
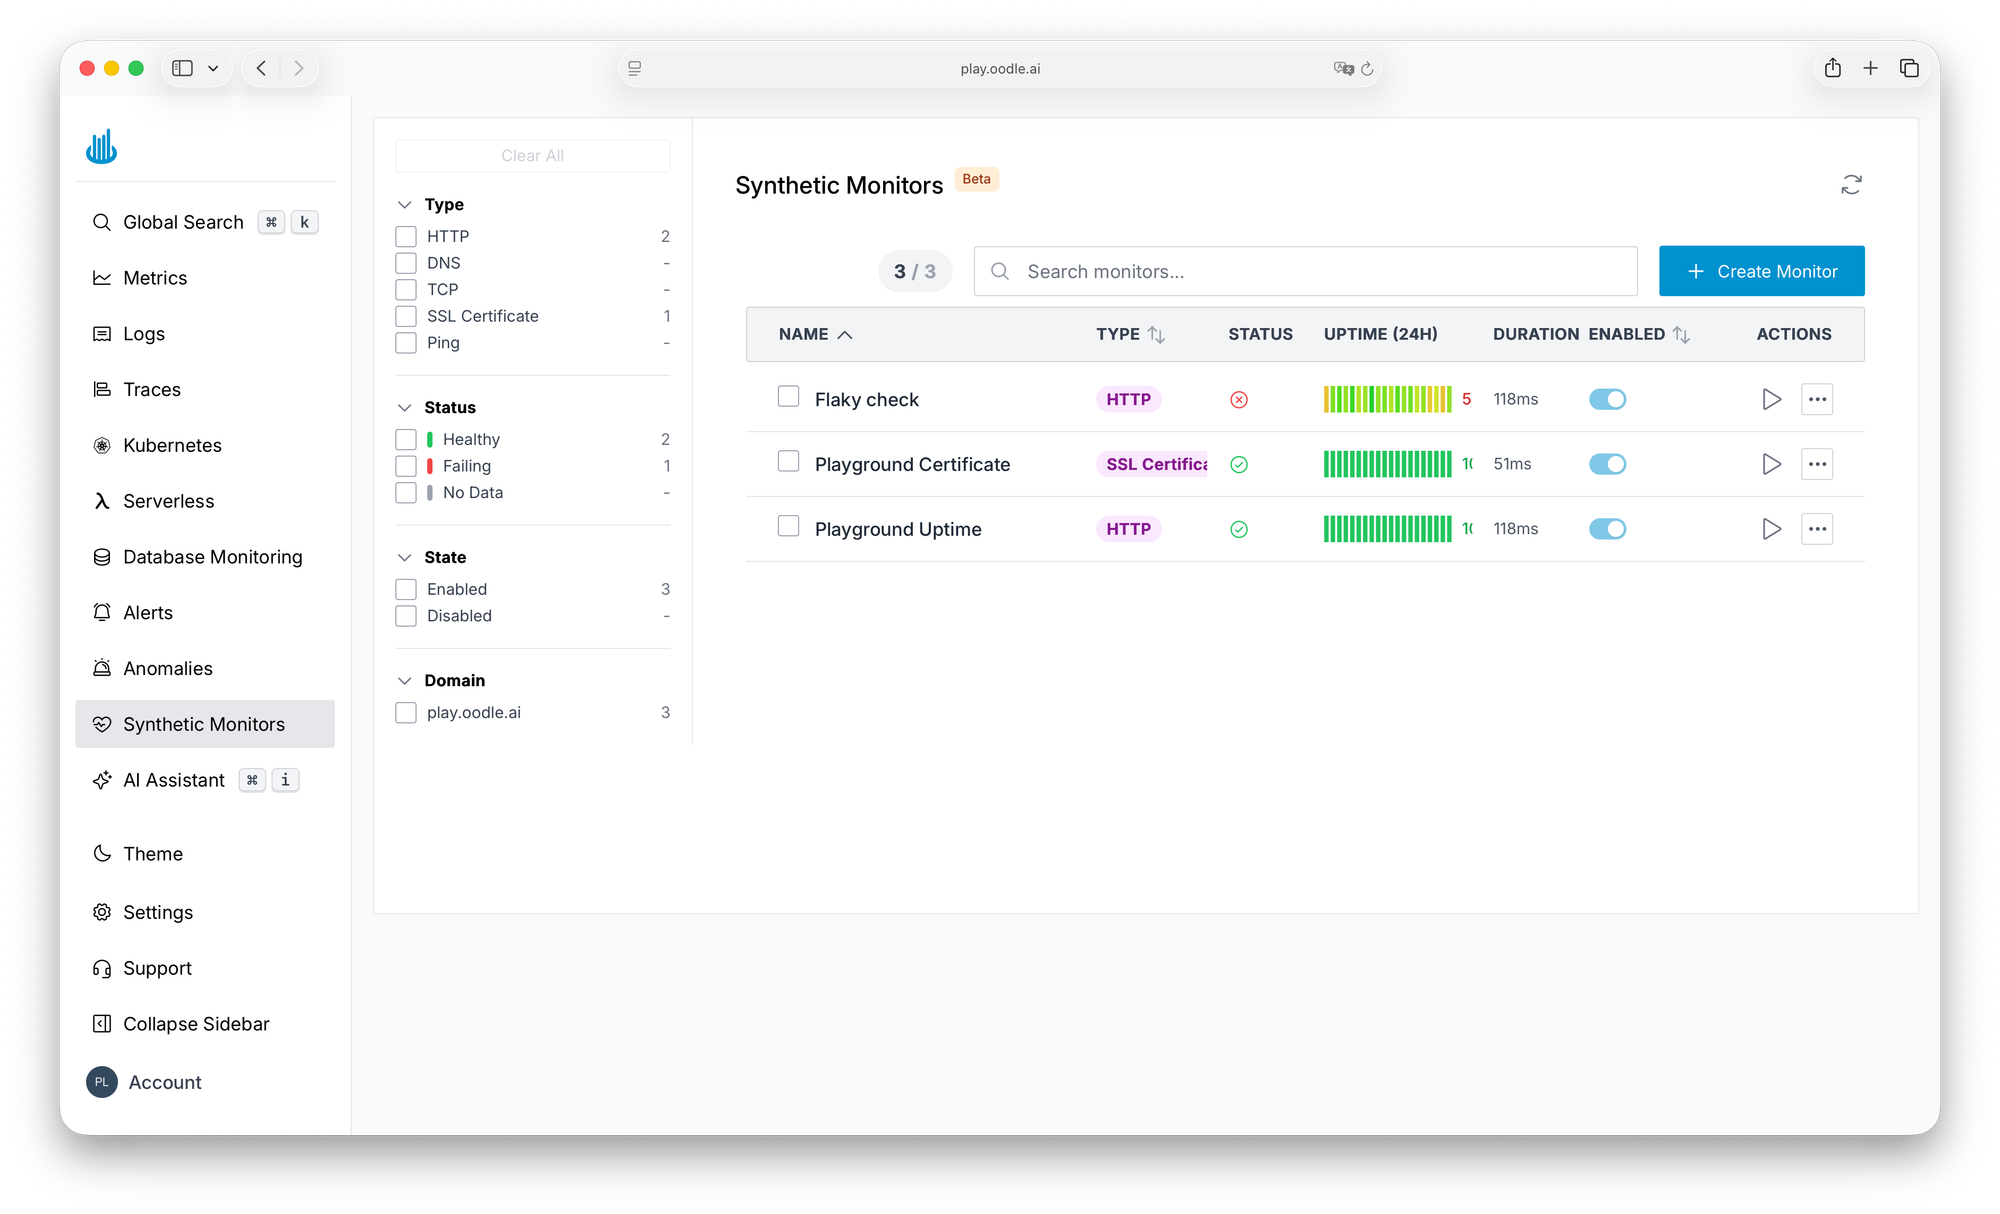
Endpoint Monitoring Without the Price Tag
Labra was paying for synthetic canary jobs through CloudWatch Synthetics. It worked, but the cost was hard to justify for basic availability checks.
Labra mentioned the need for synthetic monitoring during a Thursday PoC call. By the next meeting, Oodle had it working in dev. The day after that, the feature was live in Labra's instance. It covers HTTP, ping, DNS, TCP, traceroute, and SSL certificate checks. For Labra's public endpoints, it replaced the canary setup at a fraction of the cost.
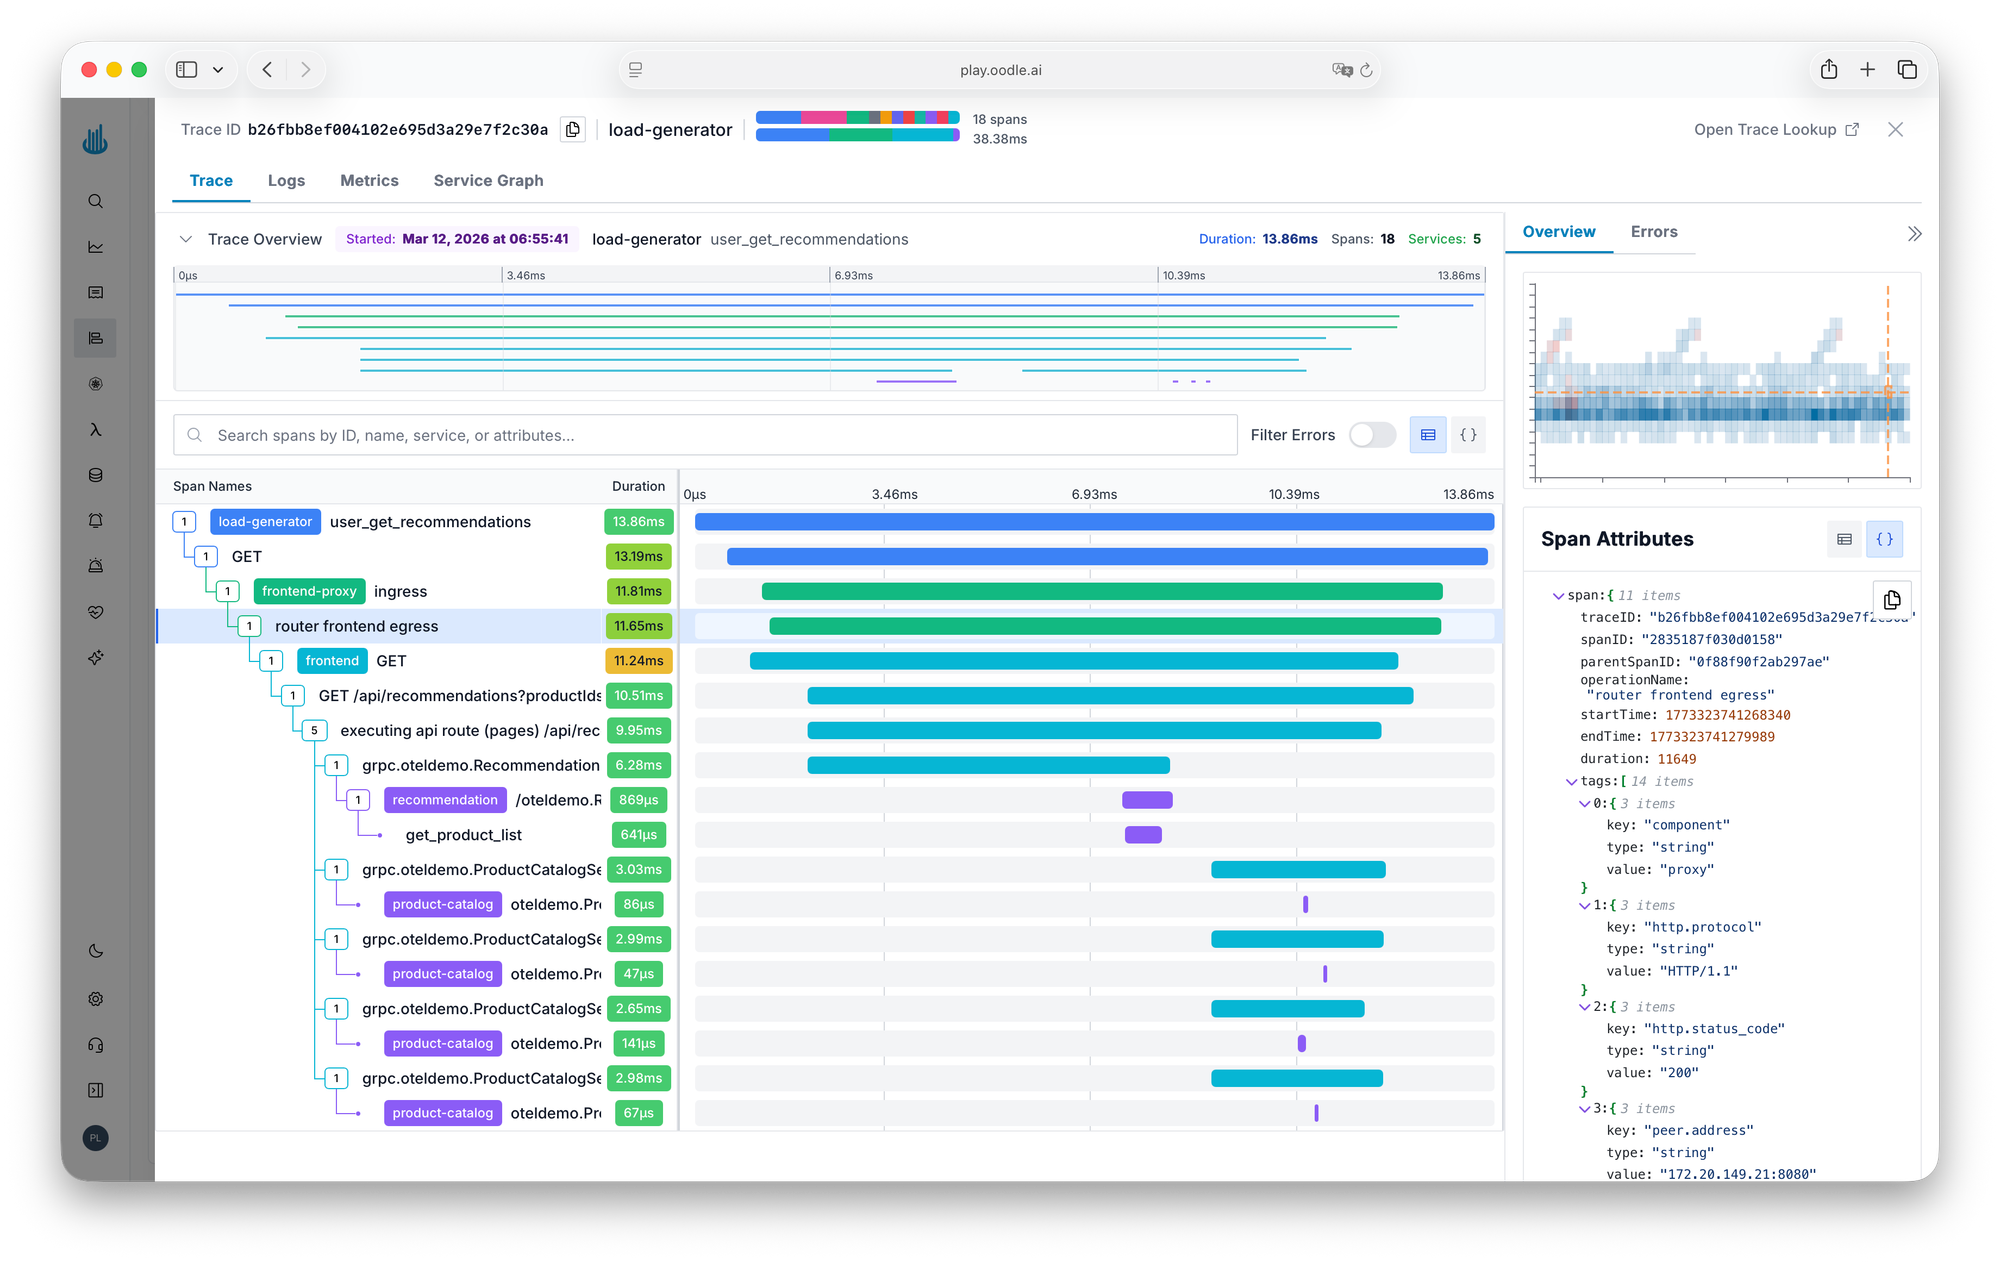
Traces That Show the Shape of Your Latency
With the OTel collector already in place for logs, traces came along for free. Shashwat called out the trace heatmap as his favorite feature: spot latency outliers at a glance, without writing queries or sifting through raw spans.
If your team is paying for many observability tools and fully using none, juggling alerts that fire for the wrong reasons while critical ones arrive hours late — that's exactly where Labra was.