200 Services, One Search Bar. How Zaggle Replaced CloudWatch and OpenSearch

TL;DR
- Zaggle unified 200+ services onto Oodle, replacing CloudWatch and OpenSearch with zero application code changes.
- Full migration via FluentBit/FireLens rolled out across all environments in a few weeks, with logs archived to S3 for compliance.
- Search time dropped from minutes to seconds. The support team now searches logs directly — without involving engineering.
Two hundred services. Multiple logging tools. And when something broke, the first question wasn't "what went wrong?" It was "which tool do I even check?"
Zaggle, a fintech company powering spend management for 3,600+ corporates and over 3.5 million end users, runs its platform on AWS ECS, backed by Lambda, RDS, and ALB. With 100+ developers shipping across 200+ services, fast access to logs isn't optional. It's how they keep the platform running. But logs were scattered across CloudWatch and OpenSearch. Finding the right log group for the right service in the right tool was a problem in itself, before anyone could even start debugging.
For non-engineering teams, it was worse. Support would search, hit a wall, and escalate to engineering, even for issues they could have resolved with the right access.
Everything gets pushed back to engineering. I just want support to search for a username, find the error. That's it. That solves 80% of the problem.
Srikanth Gaddam
CTO, Zaggle
As the platform grew, so did the gap between what the tooling could handle and what the team actually needed.
The Growing Pains
CloudWatch was the starting point
Like most AWS-native teams, Zaggle's logging started with CloudWatch. Every ECS service, every Lambda function, every RDS instance pushed logs there. For compliance, they maintained a retention policy of over a year. As a log store, it did the job.
But as the team scaled, the cracks showed. Searching logs across long time ranges was slow. With 200+ services each pushing to its own log group, developers had to know exactly which log group to check for which service and which environment. Sometimes the naming wasn't obvious, and they'd spend time just finding the right logs before they could start debugging.
Access was another challenge. CloudWatch's IAM-based controls worked at the log group level, a blunt instrument. The customer support team, who needed log access to triage integration issues, couldn't get it without risking exposure of sensitive data from other services. Most issues ended up escalated to engineering, even ones support could have handled themselves.
When the support team can't debug on their own and every issue lands on an engineer's plate, that causes so much inefficiency. A lot of leaders like me are going through the same problem. I want to fix this.
Srikanth Gaddam
CTO, Zaggle
OpenSearch helped, but was hard to scale operationally
In an attempt to provide easier search over logs, Zaggle spun up an OpenSearch cluster and streamed a subset of production logs from CloudWatch. The querying experience was better, but the operational complexity of running OpenSearch at their scale ate into platform team's time: managing index health, tuning retention, keeping the cluster performant.
Only a portion of production logs ever made it to OpenSearch due to cost and stability concerns. The rest stayed in CloudWatch, leaving developers to check both tools depending on which service they were debugging.
Fragmented and hard to maintain
The result was a patchwork: CloudWatch for most logs and OpenSearch for a subset. Developers had to know which tool to check for which service. There was no single place to search everything.
On top of that, setting up alerting in CloudWatch was complex enough that alert coverage was sparse. As the platform scaled and Zaggle's integrations with third-party systems grew, catching issues before customers noticed became a priority. They could no longer afford to wait for reports.
The team's wish list was clear:
- A single tool for all logs
- Easy enough for every developer to use
- Proactive alerting
- No infrastructure to maintain
One Interface, Zero Learning Curve
Zaggle started with a focused PoC: send logs from a few services to Oodle and see how the experience compared. The wish list (single tool, familiar UX, no infra to manage, cost that scales) was the scorecard. The PoC answered all four in days.
The UI didn't require onboarding. Oodle's log explorer uses an OpenSearch-compatible interface. Zaggle's developers could use the same Lucene syntax and click-based filtering they already knew. Instead of navigating hundreds of individual CloudWatch log groups, they could search across all services from one interface. Filters, labels, and the fields that matter surfaced in a few clicks, without hunting through menus or writing query syntax to slice by application, environment, or service.
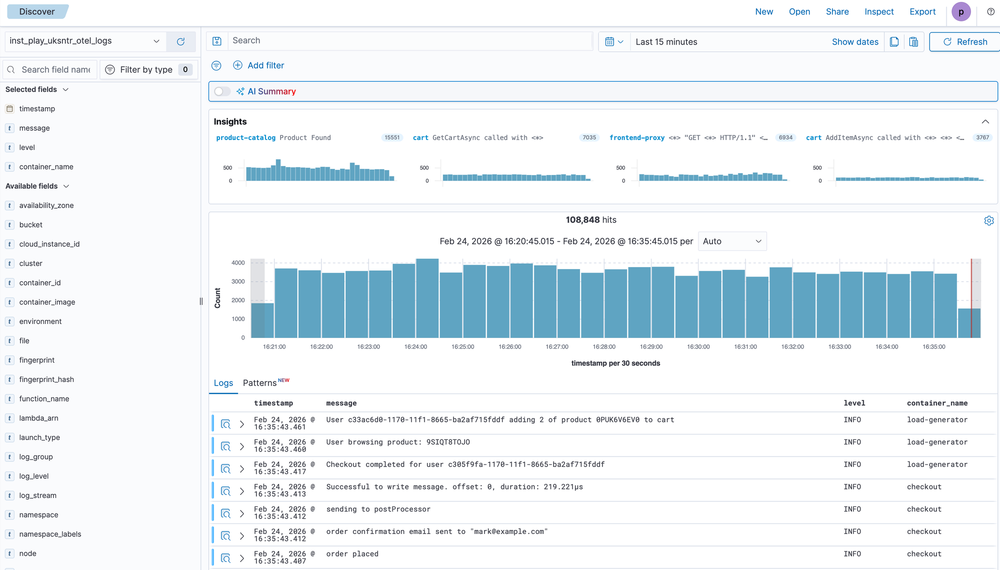
Structured JSON logs are parsed and searchable out of the box. Oodle surfaces error patterns and insights automatically, making it easy to spot new errors after a release without writing a single query.
The interface felt familiar right away. We didn't need any training to get started.
Kannaiah Naidu Annanki
Sr. DevOps Manager, Zaggle
No infrastructure to manage. Unlike OpenSearch, there were no clusters to tune, no index health to monitor, no retention policies to wrestle with. The operational burden that had made OpenSearch hard to scale simply didn't exist.
Cost that actually scales. Unlike the solutions they evaluated, Oodle's pricing worked at the scale Zaggle needed. They could send all their logs, not just a subset.
The PoC was supposed to be a careful evaluation. It turned into a rollout. Within weeks, the team expanded from a handful of log groups to all production applications.
Zero Code Changes, Full Migration in Weeks
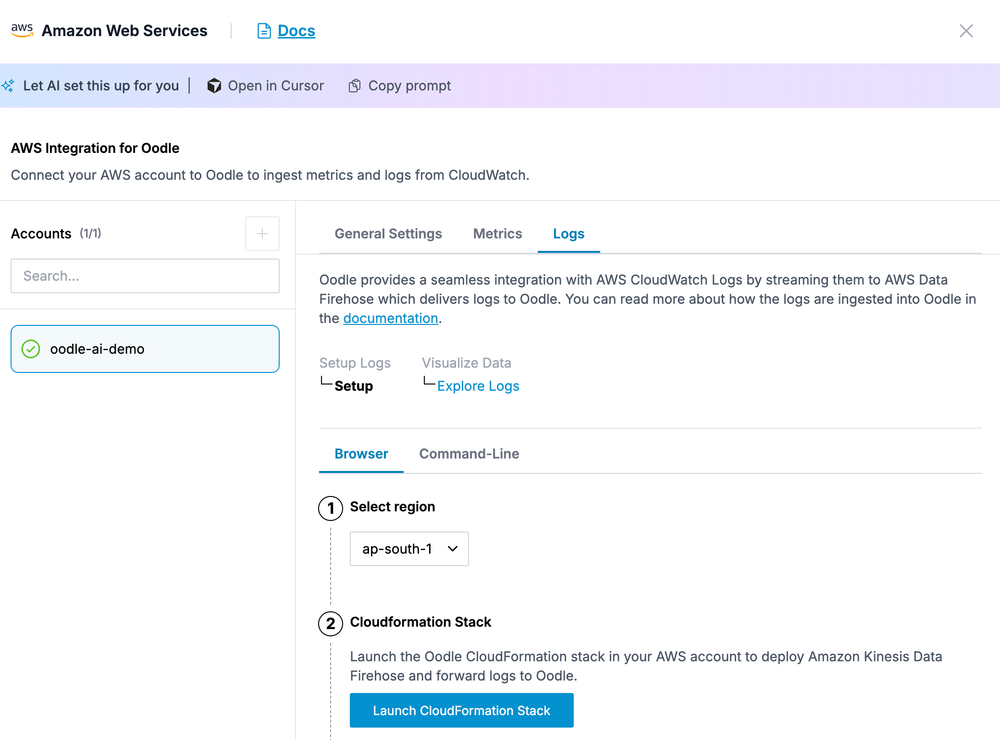
The initial setup was fast. Oodle ingested logs via CloudWatch subscription filters, with no changes to application code or ECS task definitions. Logs started flowing the same day.
The Oodle team worked alongside Zaggle to set up index patterns per environment, import existing OpenSearch dashboards, and configure access controls. ALB logs came next, ingested directly from S3. Database logs followed. Within weeks, all log types were flowing into a single platform.
Once the team was confident, all developers moved to Oodle as their primary observability tool.
The next step was removing CloudWatch from the pipeline entirely. Using FluentBit with FireLens, logs from ECS containers were shipped directly to Oodle and simultaneously archived to S3 in Zaggle's own AWS account for compliance. Rolling this out across 200+ services took a few weeks, starting with dev, validating, then moving to other environments.
With logs stabilized, Zaggle began sending traces using the OpenTelemetry agent, with trace-to-log correlation working through shared trace IDs.
Architecture: Before and After
Before Oodle: Logs were scattered across multiple tools. CloudWatch held most application logs and OpenSearch indexed a subset for better search. Developers switched between tools depending on which service they were debugging. Alerting was minimal and reactive.
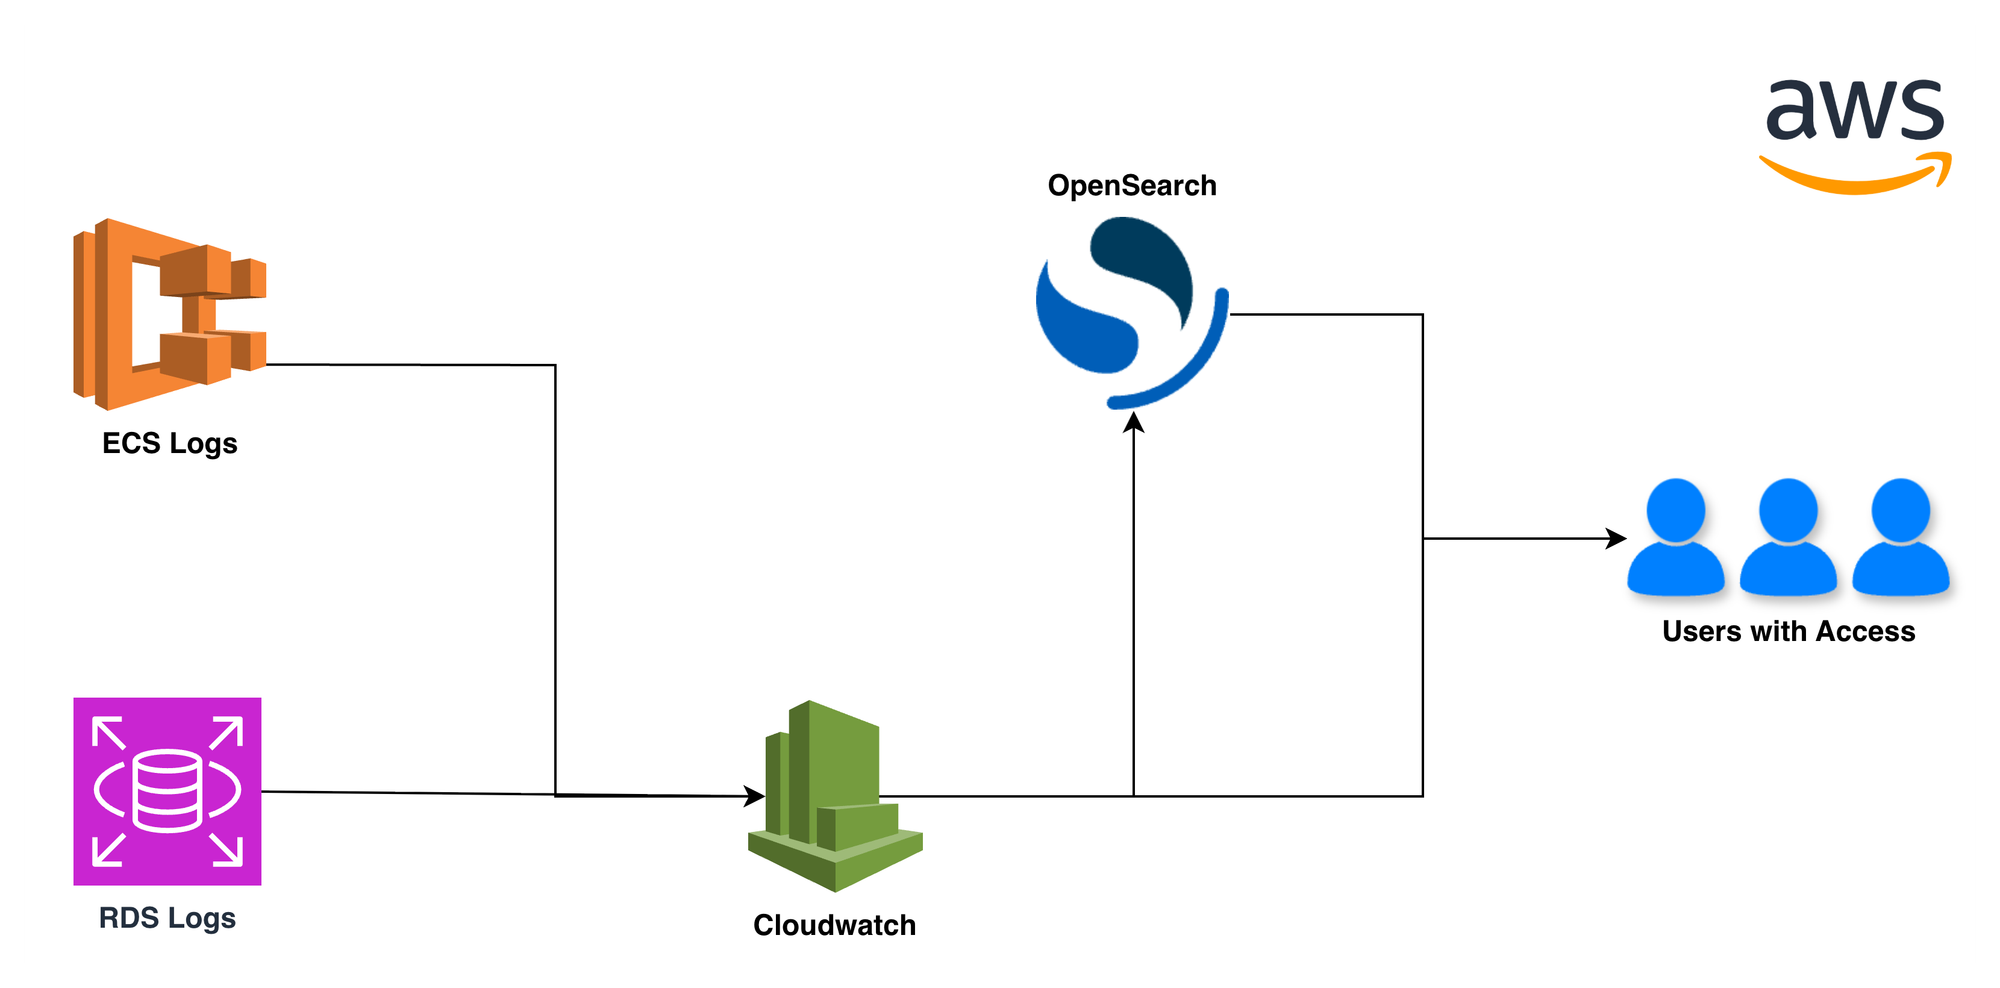
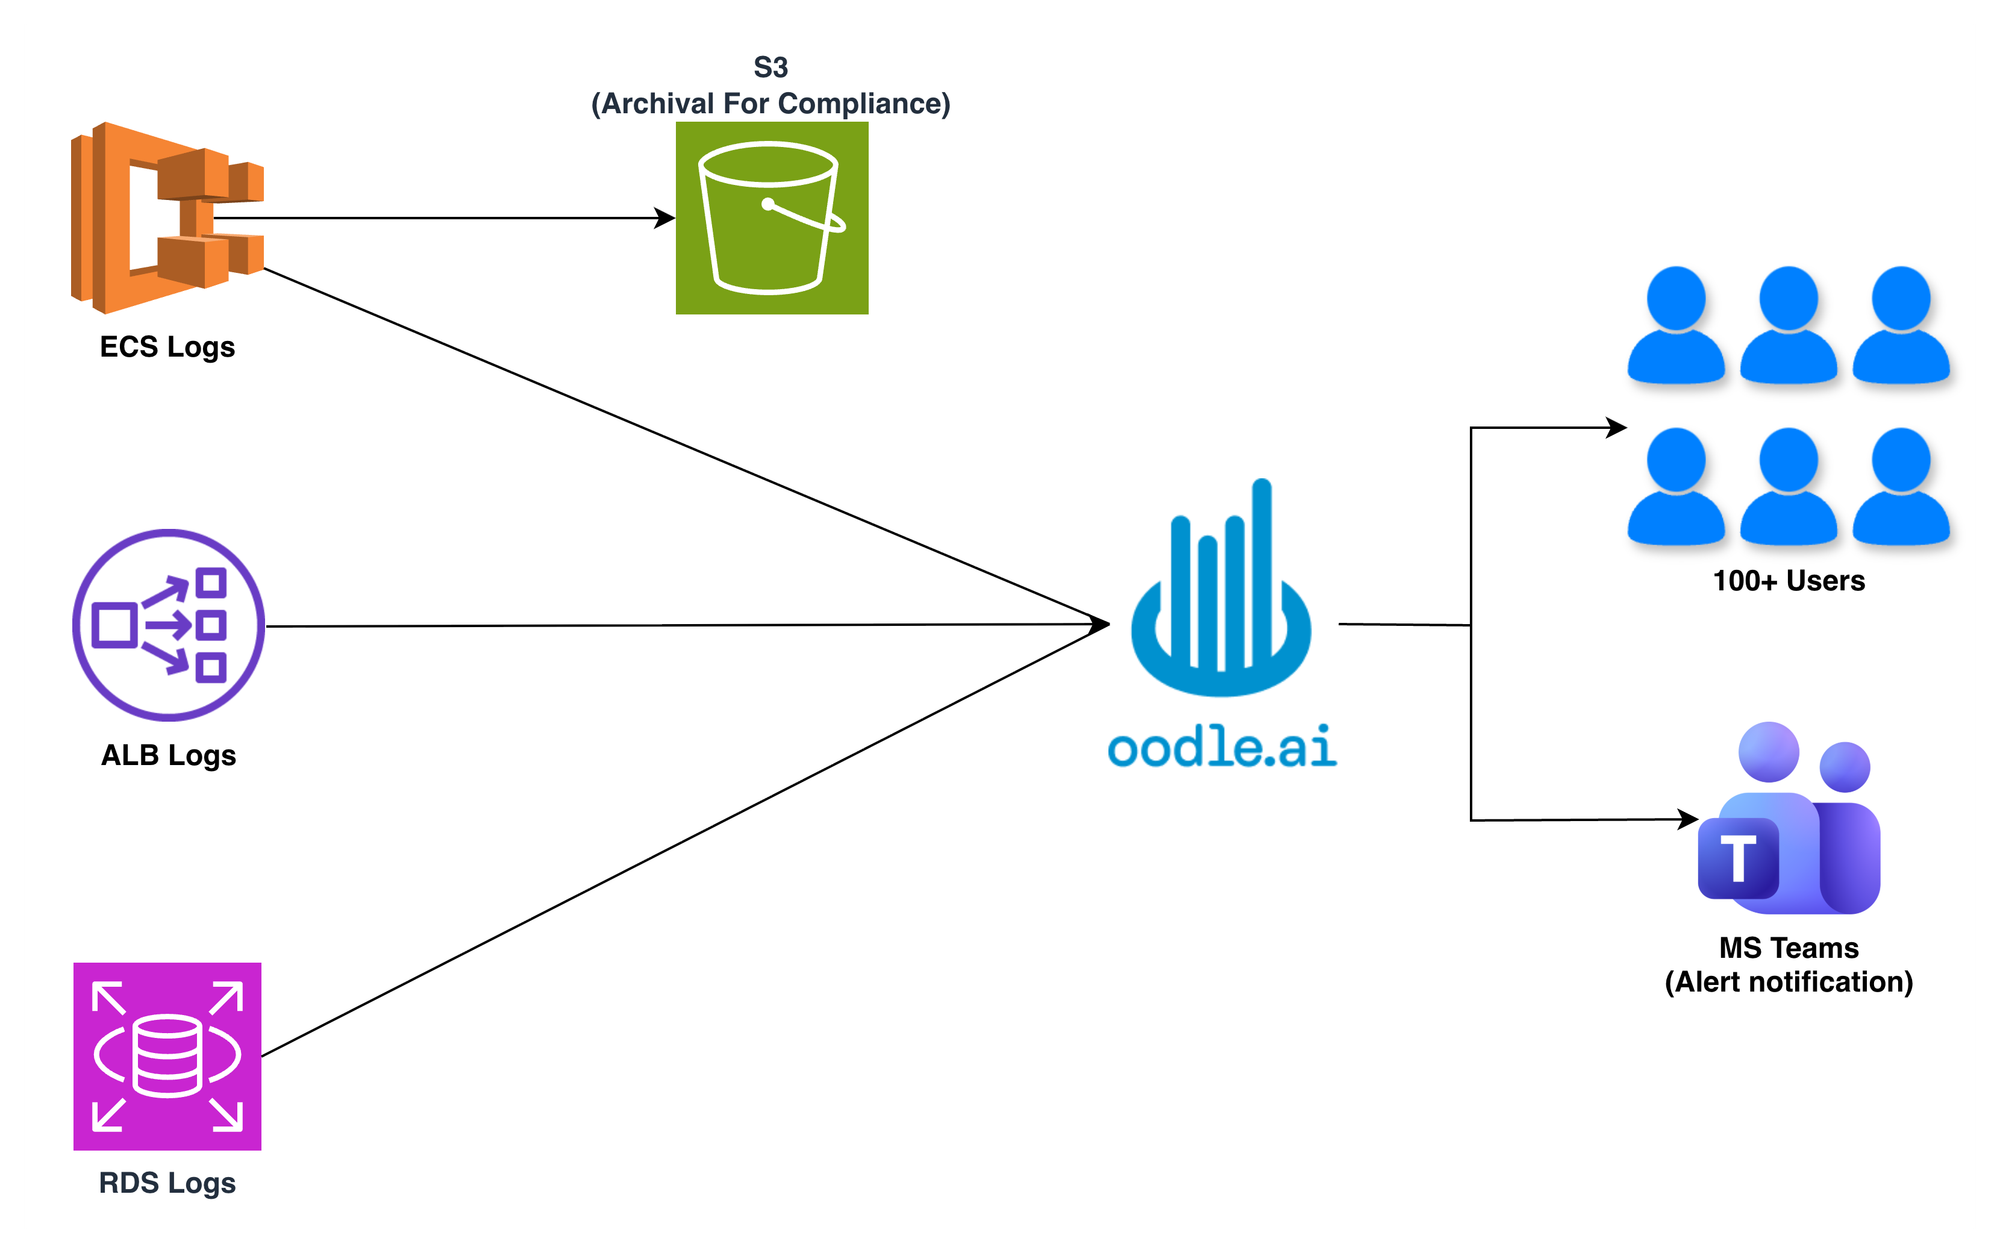
After Oodle: All log types (application, ALB, database) flow into Oodle via FluentBit/FireLens, with a parallel archive to S3 for compliance. One platform for search, dashboards, alerting, and traces. CloudWatch is out of the debugging path entirely.
What Changed
One Search for All Services
The most visible shift: developers stopped asking "which tool has the logs for this service?" Every developer at Zaggle, across application logs, ALB logs, and database logs, searches in one place now.
Currently, no one is using CloudWatch. Everyone is on Oodle.
Venkateswara Rao
Zaggle
The patchwork is gone. No one checks CloudWatch for one service and OpenSearch for another. The cognitive overhead disappeared.
From Minutes to Seconds
CloudWatch searches across long time ranges used to take minutes, long enough to break a debugging flow. With Oodle, the same queries complete in seconds. And instead of manually correlating logs across services, developers use trace IDs to follow a request through the entire stack in one interface.
CloudWatch searches for longer time ranges used to take minutes, slowing down debugging. After switching to Oodle, queries now complete in seconds, and the ability to filter logs on multiple applications has made troubleshooting much faster and more efficient.
Nageswara Rao Rayala
Engineering Manager, Zaggle
Alerts Before Customers Complain
Without proactive alerting, the team had no way to catch issues before they became visible. Now they have monitors on load balancer errors, slow database queries, critical business flow failures, and deployment events, all routed to Microsoft Teams so the right team gets notified early.
Developers started finding and fixing slow queries proactively. That shift from reactive to proactive changed how the team operates.
Teams are using Oodle efficiently. They're able to search logs, find slow queries, and fix them. The work is happening — they're actually using Oodle now.
Venkateswara Rao
Zaggle
Support Can Finally Search Logs
Remember the problem Srikanth wanted to solve? Oodle's field-level RBAC made it real. Instead of CloudWatch's blunt log-group-level IAM policies, access controls are set by service name, environment, or data classification. Sensitive services stay locked down. Everything else is open.
The customer support team, who used to escalate every integration issue to engineering, now searches logs directly. More people self-serve because the right guardrails are in place.
Compliance Built In
As a payments fintech handling PCI and SOC audits, Zaggle needs to answer auditors about their logging infrastructure. The dual-write architecture (logs to Oodle for real-time debugging, archived to S3 in Zaggle's own AWS account for long-term retention) gives them both operational speed and audit readiness without compromise.
Oodle has significantly streamlined our log management by giving us a single platform for search, analysis, and monitoring. It helped us cut down our CloudWatch costs while making log searches faster and easier. With automated log metrics and alerts integrated into Teams and email, our team now detects and resolves issues much more proactively.
Kannaiah Naidu Annanki
Sr. DevOps Manager, Zaggle
Oodle replaced CloudWatch and OpenSearch with a single, faster platform. Log search is much faster than our AWS OpenSearch, and built-in alerting and RBAC features are exactly what we needed.
Srikanth Gaddam
CTO, Zaggle
What's Next
Zaggle's roadmap with Oodle is expanding. The next focus is increasing adoption of distributed tracing with OpenTelemetry across more services and unifying APM into Oodle, replacing the last remaining piece of their fragmented stack.
The team that once juggled multiple logging tools now runs on one platform. And they're not looking back.