Three Clouds, One AI Assistant: How Wisdom AI Unified Observability on Oodle

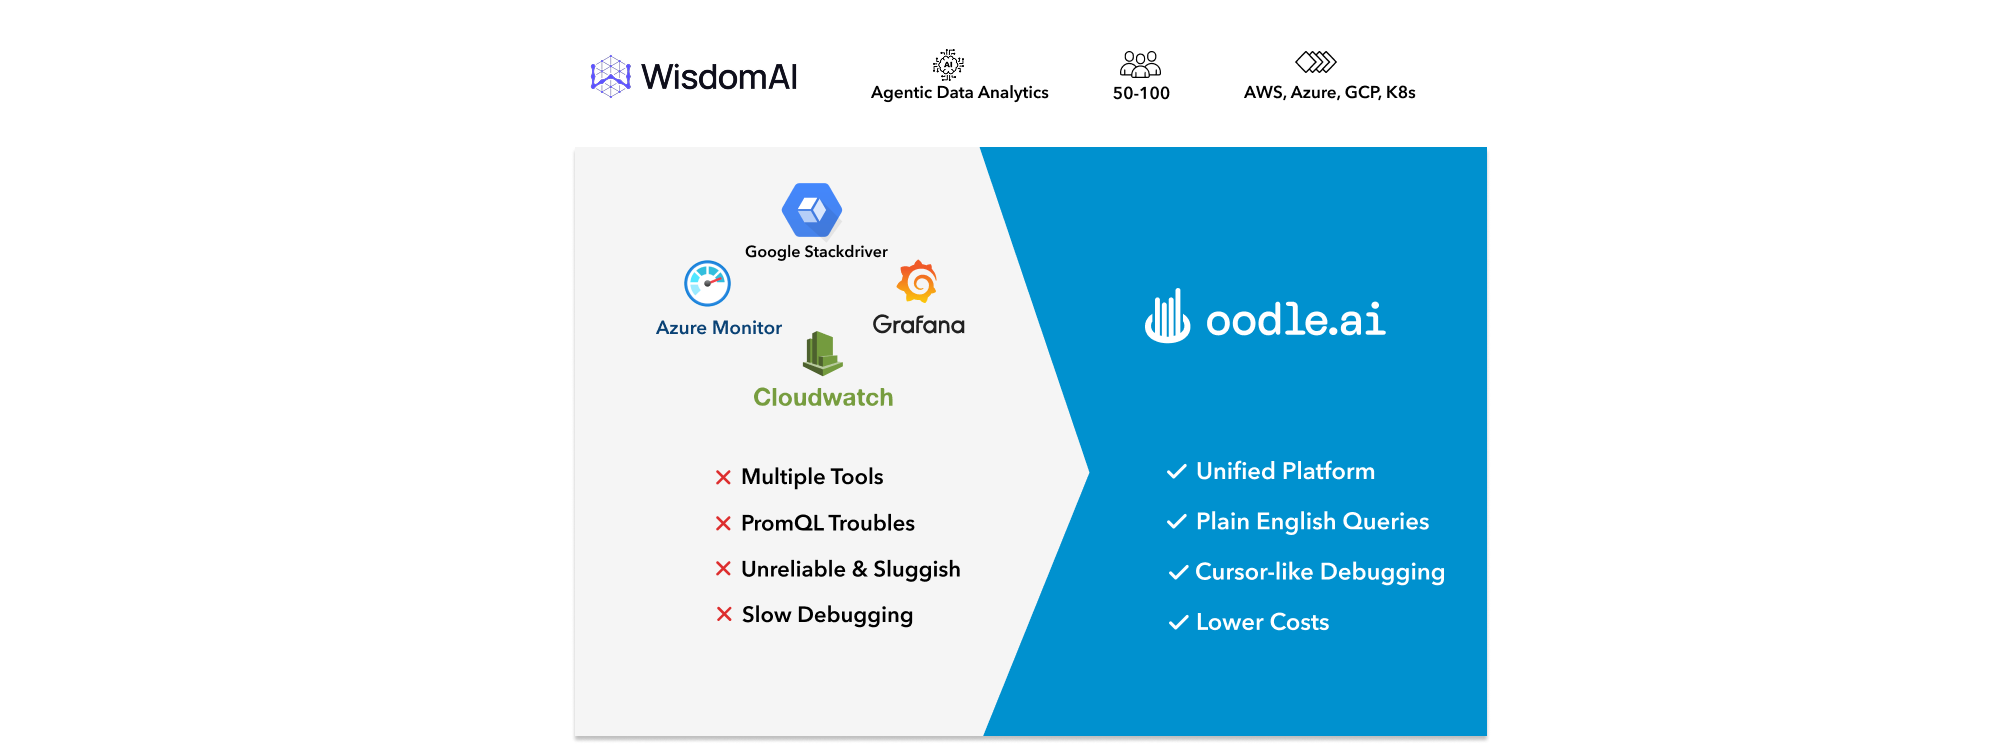
- 3x lower costs than CloudWatch
- Single pane for all deployments across three clouds
- AI assistant eliminates PromQL friction — engineers build dashboards and alerts in plain English, asks questions in plain English
"This Doesn't Look Like a Product"
Three clouds. A hundred deployments. And every time something broke, someone opened four browser tabs and hoped for the best.
Wisdom AI builds agentic analytics — natural-language insights across structured, unstructured, and MCP-connected data sources. Co-founded by Sharva (formerly founding engineer at Glean and Rubrik), the company runs a hybrid model: most customers use Wisdom as SaaS, while others deploy the full stack in their own cloud for data sovereignty. That model is great for customers. It's brutal for observability.
When Wisdom was AWS-only, CloudWatch was the default. It worked, barely. Filtering on specific labels or customer IDs was possible in theory but painful in practice. Engineers didn't want to log into CloudWatch to debug — they resorted to writing CLI scripts to pull logs and grep through them locally. As Wisdom expanded to GCP and Azure, things got worse. Logs were now in three places: CloudWatch, Cloud Logging, and Azure Monitor. Each had its own query syntax, its own filter semantics, its own alerting model. Debugging a single customer issue meant opening several cloud consoles, mentally correlating timestamps, and hoping you didn't miss the signal buried in a different account.
"Pretty much everyone I talked to was like, we need to buy a product. This doesn't look like a product."
— Sharva, CTO at Wisdom AI
The team tried self-hosted Grafana for metrics and alerting. It didn't hold up. Grafana didn't offer a unified logging story — logs and alerting lived in separate systems, so debugging still meant jumping between tools. Operationally, the self-hosted deployment was brittle: OOMs and reboots were common, the UI was sluggish under load, and the team didn't have time to tune it properly. Alert deduplication and grouping — e.g., one alert per customer instead of a flood of near-duplicates — were hard to configure. And metrics meant PromQL, which most engineers didn't want to learn just to set up a dashboard.
"learning and using PromQL is a pain, but Oodle's assistant acts as a copilot on the page that we are on and can take actions on our behalf. I just prompt it to create a dashboard containing these panels and it just works. It is magical."
— Tanish, Founding Engineer at Wisdom AI
Wisdom needed centralized observability that was cost-effective, reliable, and modern — and that could scale with 100+ deployments without requiring a dedicated platform team to babysit it.
Why Not Datadog?
Wisdom evaluated the usual options. Datadog was the first call. The team's rough estimate made it non-viable to start with. With 250+ nodes and 5000+ workloads running across AWS, GCP and Azure, Datadog would have been 5x costlier than Oodle. GCP's Stackdriver (now Cloud Operations) was looked at for consolidated logging, but the UX didn't meet the bar. Self-hosted Grafana had already shown its limits.
The decision criteria were clear:
- One platform for logs, metrics, traces, and alerts
- Native support for multi-cloud and 100+ deployments
- A responsive, modern UI that engineers actually want to use
- AI-native features that remove the query language barrier by allowing users to ask questions in plain English
- A vendor that ships fast and listens
Oodle fit those requirements at a fraction of the cost of Datadog.
"It's the best way to do observability. I'm surprised you get such good observability at a cheaper cost than native AWS and GCP capabilities. Usually there's a trade-off between cost and features. Here you're getting both."
— Anuj, Founding Engineer at Wisdom AI
From PoC to Production in Weeks
Anuj Mittal, founding engineer at Wisdom, owns platform and infrastructure. He ran a focused proof-of-concept: one dev deployment, then scale-out. Setup was straightforward involving installing a helm chart and all telemetry signals were flowing to Oodle, and the Oodle team was responsive — issues got addressed in hours, not weeks. There was no long bake-off. Oodle addressed centralized observability and cost in one move.
Migration proceeded in phases. Logs and traces moved to Oodle first; metrics and dashboards followed. All existing Grafana dashboards and alerts were automatically migrated using the Oodle's Grafana migration tool. In-product links within Wisdom product that previously pointed to CloudWatch or GCP Logs Explorer now point to Oodle, so engineers start and finish debugging in one place.
"it was very easy to just set it up. We started with one dev deployment, set it up there, saw that it was helping"
— Anuj, Founding Engineer at Wisdom AI
Today, almost every engineering team at Wisdom uses Oodle for logs and traces. Adoption extends beyond engineering — support and other roles use Oodle when they need to debug customer issues.
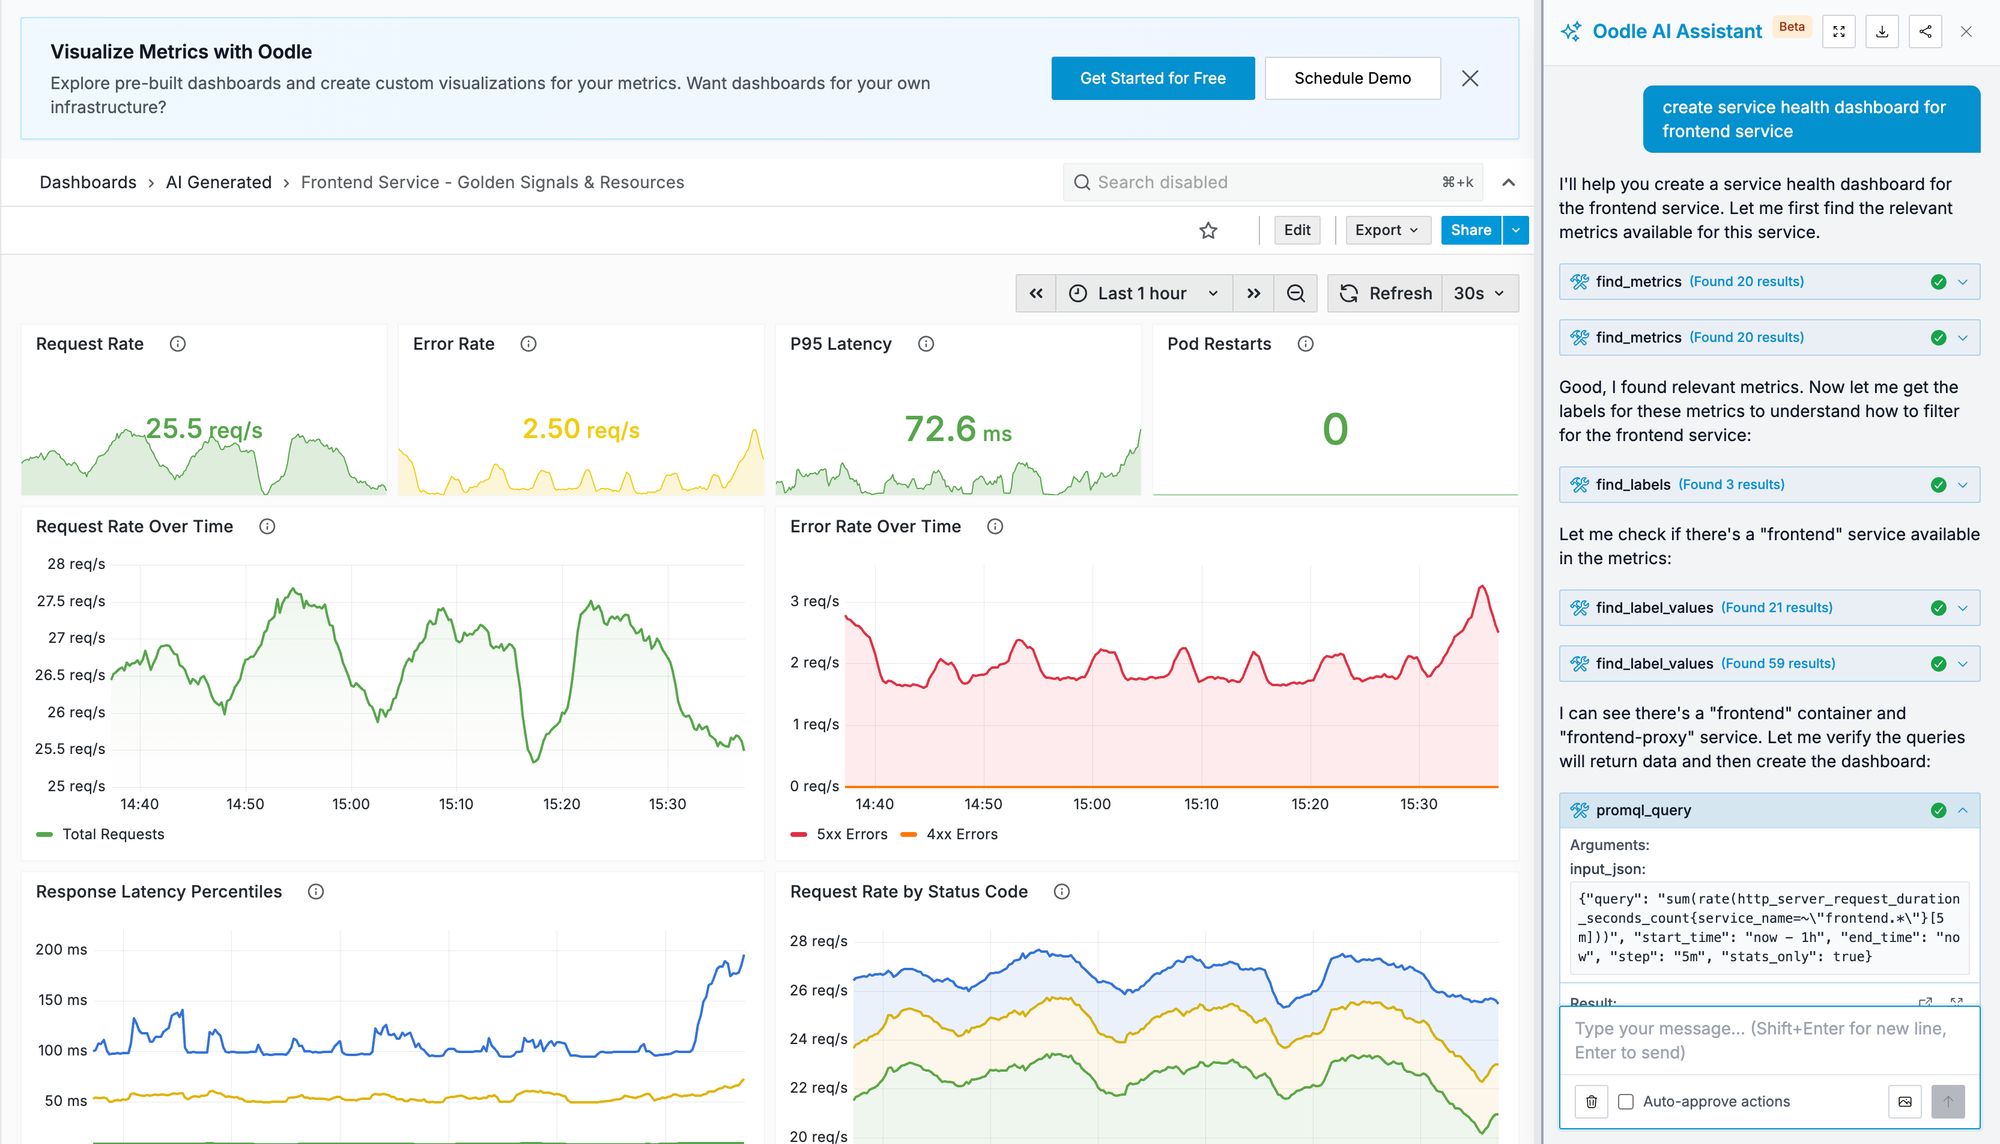
Dashboards in Plain English
PromQL was the biggest friction point on the metrics side. Most engineers at Wisdom are application developers — they don't want to learn a query language just to build a dashboard or set up an alert. The Oodle AI assistant changed that. Engineers describe what they want in plain English or paste metric definitions from code, and the assistant suggests PromQL queries and explains the nuances — delta vs. increase, rate windows, label selectors.
Anuj described a moment during the transition: he needed to recreate a Grafana dashboard in Oodle. Instead of looking up PromQL syntax, he used the AI assistant and had it done in minutes. No docs. No Stack Overflow.
Wisdom also uses Oodle's cost and usage attribution to see which metrics drive cardinality and cost. That visibility let them trim low-value sources — broad Kubernetes and Envoy metrics they didn't actually need — reducing cost without losing signal.
Logs UI: Intuitive & Feature Rich
The first thing engineers noticed after moving to Oodle was how little friction there was in the logs experience. Filters, labels, and the fields you actually care about surface in a few clicks — no hunting through menus or writing query syntax to slice by customer, cloud, or service.
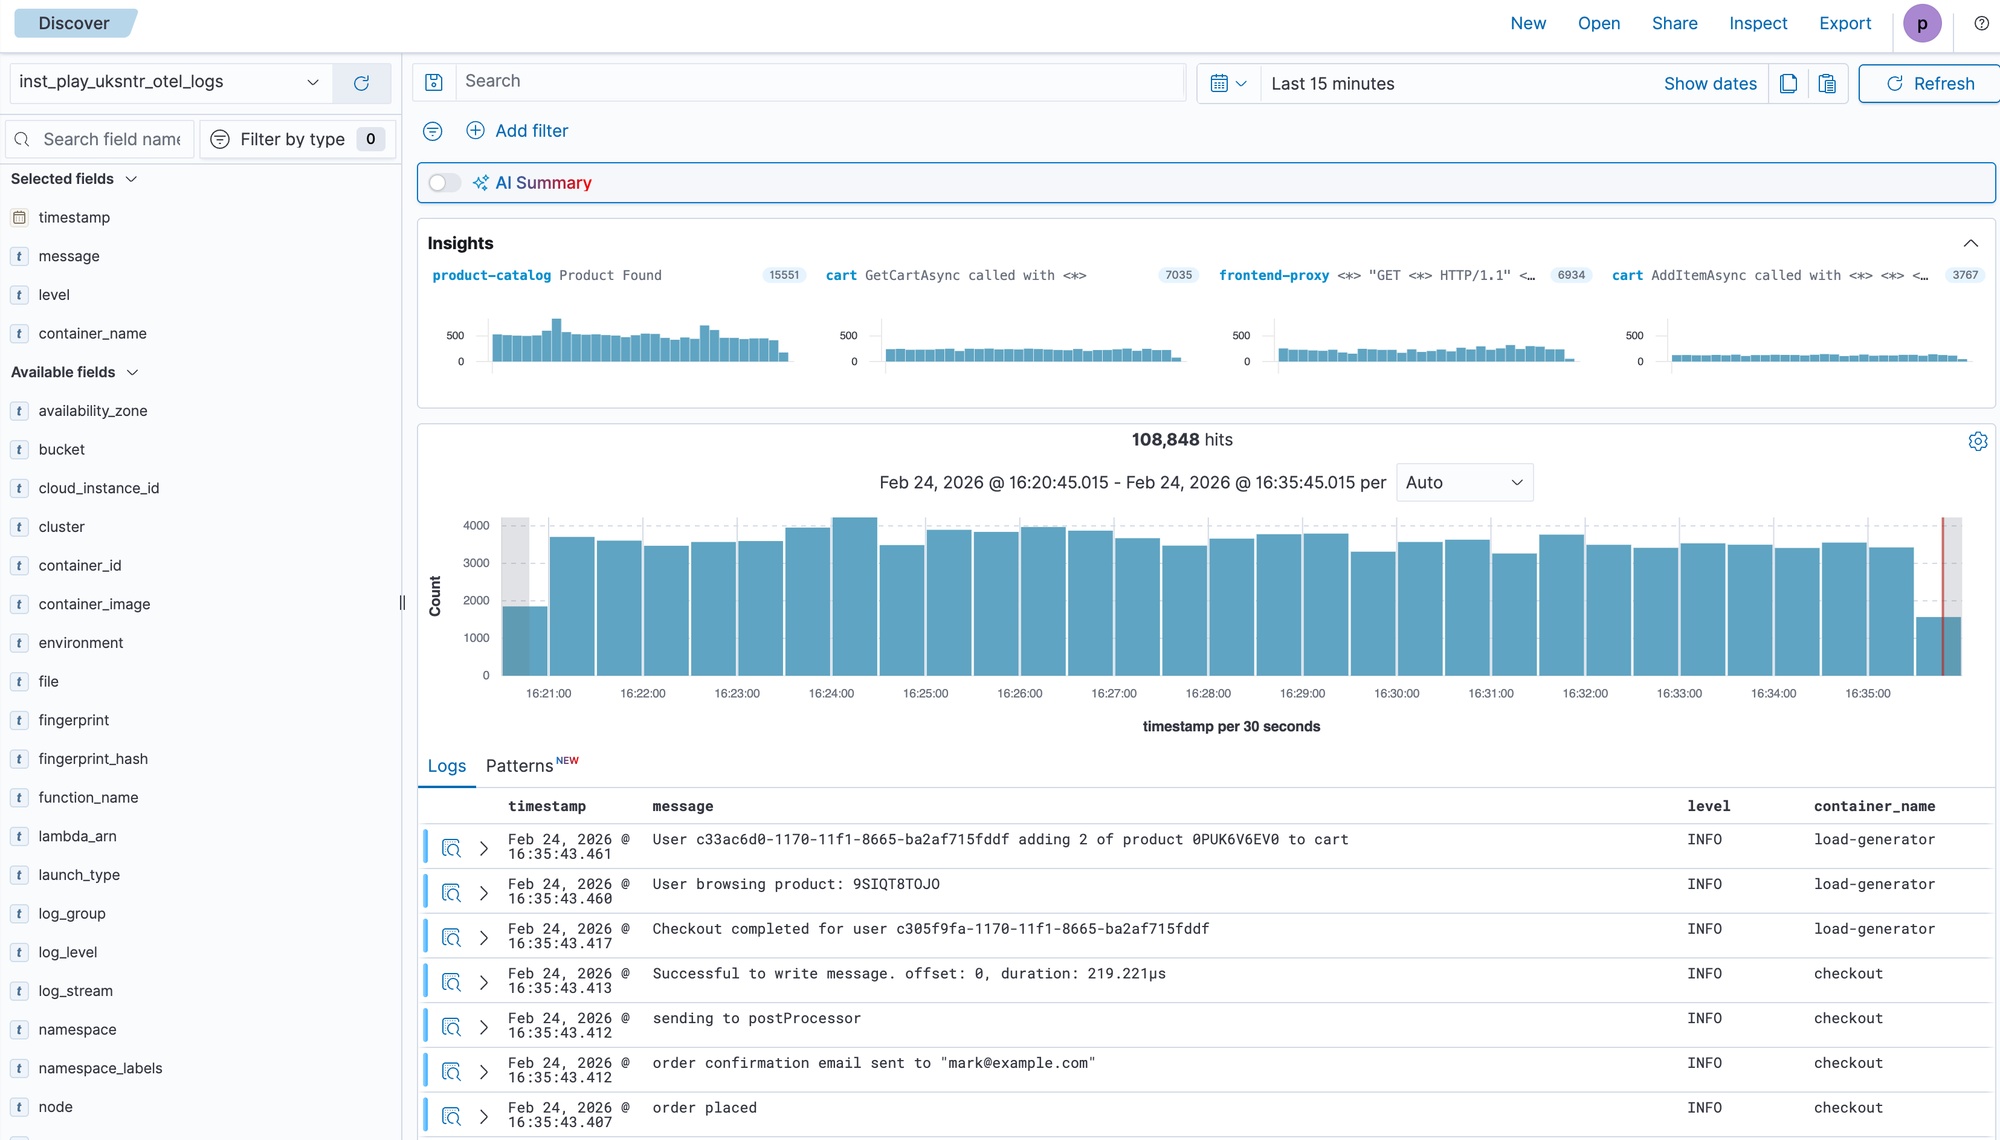
The command palette (Cmd+K) takes it further. Need to show or hide a field across every log line, or add a filter mid-investigation? Instead of clicking through menus, hit Cmd+K, type what you want, and it just works.
"If I'm looking at logs and I need to show or hide a field, or add a filter — I don't need to do that manually. I just press Cmd+K and type it there and everything just works. It's so seamless."
— Tanish, Founding Engineer at Wisdom AI
Oodle's Logs UI provided much simpler ways to find relevant logs, work with structured JSON logs, filter for relevant customers etc. It surfaces error patterns and insights from logs automatically making it easier to notice any new errors after releases quickly.
"My experience with Oodle has been pretty good so far. I didn't think changing the logging software would affect my life so much!"
— Varun, Founding AI Engineer at Wisdom AI
The result: developer happiness went up measurably. Engineers stopped writing custom scraping scripts. They stopped context-switching between cloud consoles. They started and finished debugging in one place.
Oodle AI is everywhere - Slack, Cursor, UI
Integrations tightened the feedback loop in ways the team didn't expect.
"That MCP server that we have with Oodle — it's a game changer for us."
— Anuj, Founding Engineer at Wisdom AI
Alerts fire into Slack. An integration triggers Oodle Slack Bot to fetch the logs relevant to that specific alert and post them into the same Slack thread. Previously, on-call engineers had to infer which job or service failed, then hunt for logs across one or more cloud consoles — often 10–15 minutes of toil before they even understood the problem. Now the logs appear in Slack before they open the alert.
Engineers also use the Oodle MCP server in Cursor: when debugging a failing job or unexpected behavior, they ask the AI in Cursor to pull logs or telemetry from Oodle directly in their IDE.
"I personally use Oodle's MCP server a lot. It is a game changer. I don't need to manually add filters and look at logs, understand them, and then root cause the issue - I let Cursor do it for me. The tools in the MCP server are very intuitive as well, so any agent can easily use it without needing to add much context."
— Tanish, Founding Engineer at Wisdom AI
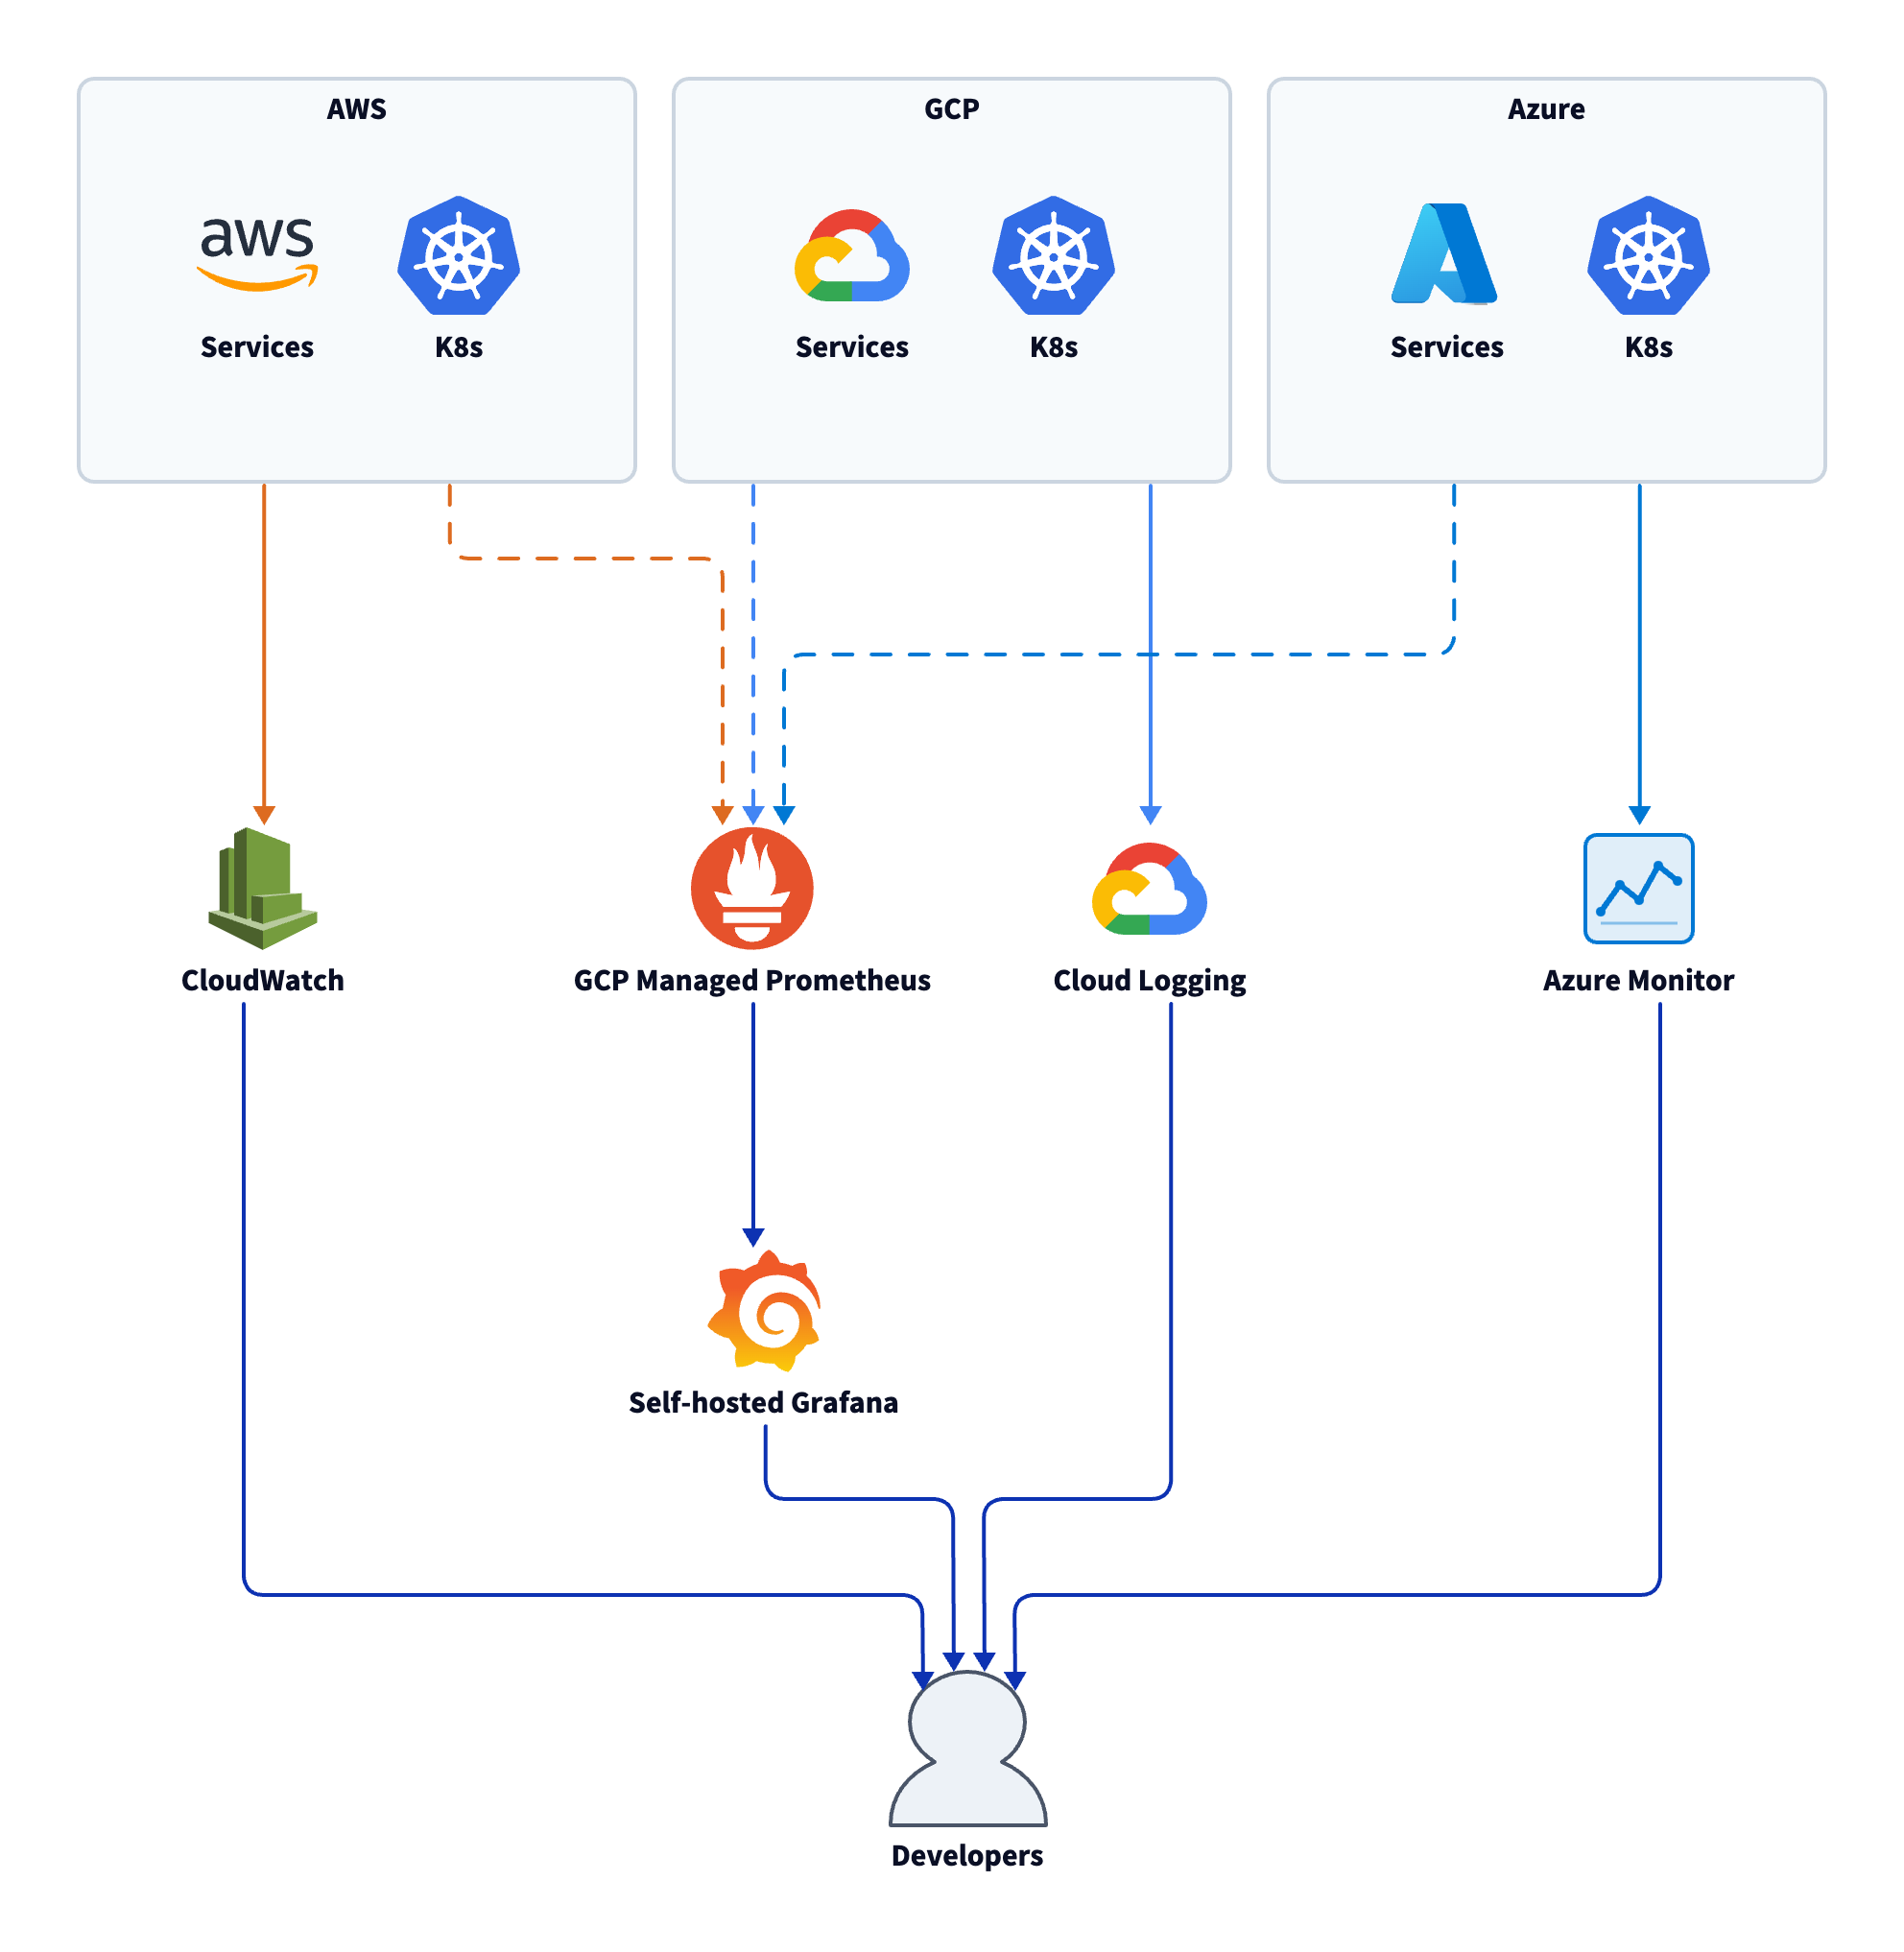
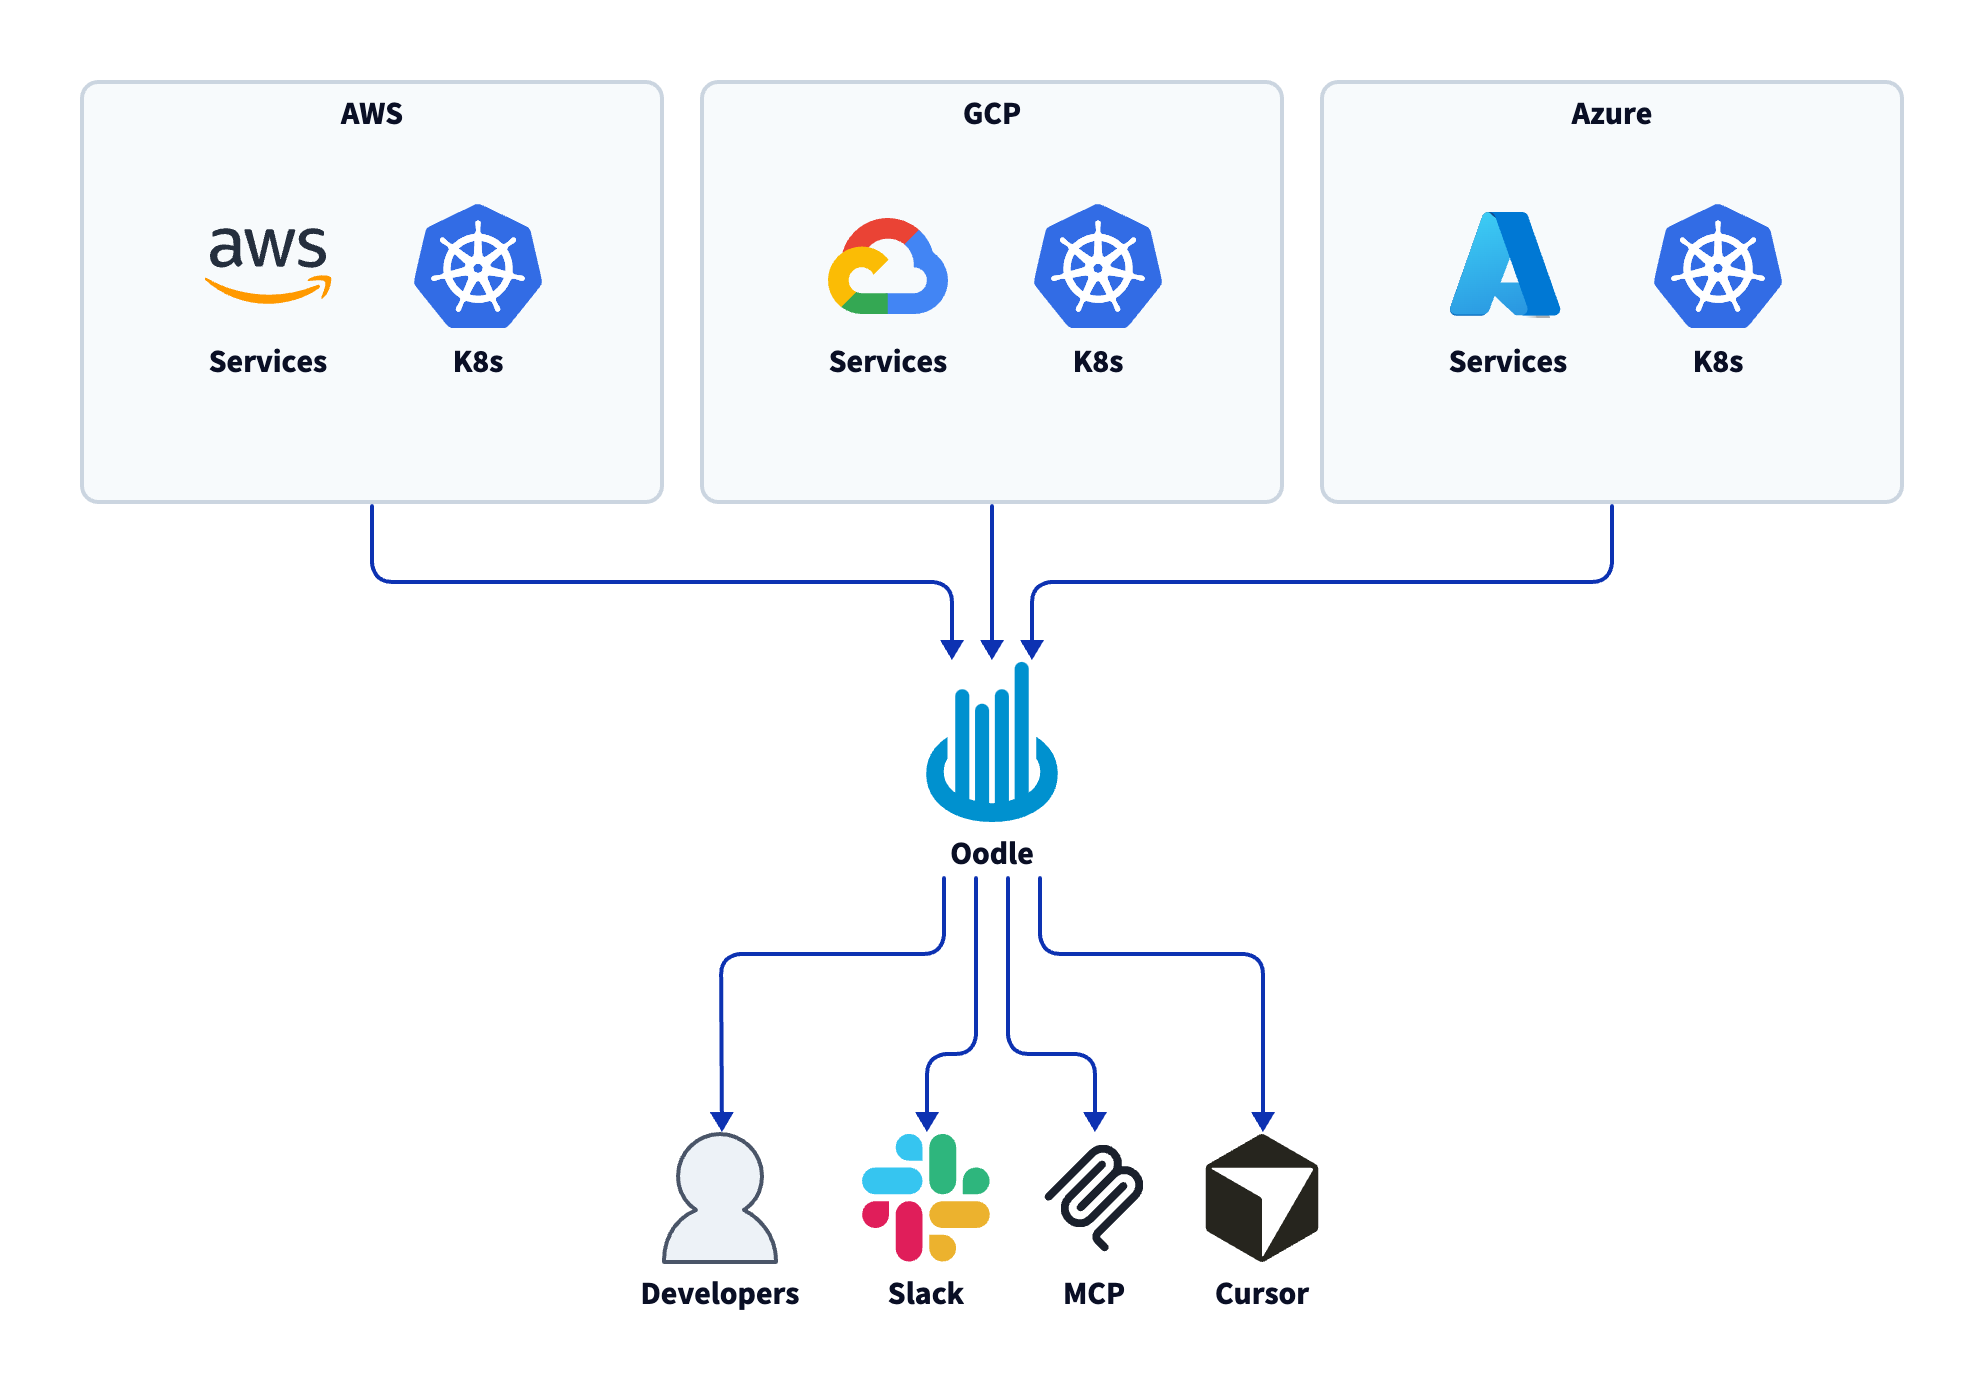
Architecture: Before and After
Before Oodle: Services across AWS, GCP, and Azure each sent logs and metrics to their own native tool. A self-hosted Grafana instance tried to aggregate metrics but had reliability issues. Engineers switched between three or four UIs and wrote ad-hoc scripts for cross-customer debugging.
After Oodle: All three clouds send logs, metrics, and traces into Oodle via vmagent and OTLP. A single workspace provides dashboards, alerts, log search, and DB monitoring. The AI assistant, MCP integration (Cursor), and Slack alerting sit on top of one unified data plane.
What Changed
Cost. The largest savings were on traces. CloudWatch charges per trace; Oodle's volume-based model gave Wisdom roughly 4–5x lower trace costs. Logs were also significantly cheaper. Without Oodle, Wisdom would have been forced to cut trace volume or reduce sampling to control spend — at a stage where granular tracing matters most. Instead, they kept full fidelity and stopped worrying about cost.
"if we had not switched to Oodle at this point of time, we would have been thinking about cutting down on those traces, reducing and figuring out like, is it really needed and all of that. And given that we are at the growth stage, we don't really want to focus on those things at this point of time. We want to just focus on building new things rather than figuring out - can I drop this to reduce costs?"
— Anuj, Founding Engineer at Wisdom AI
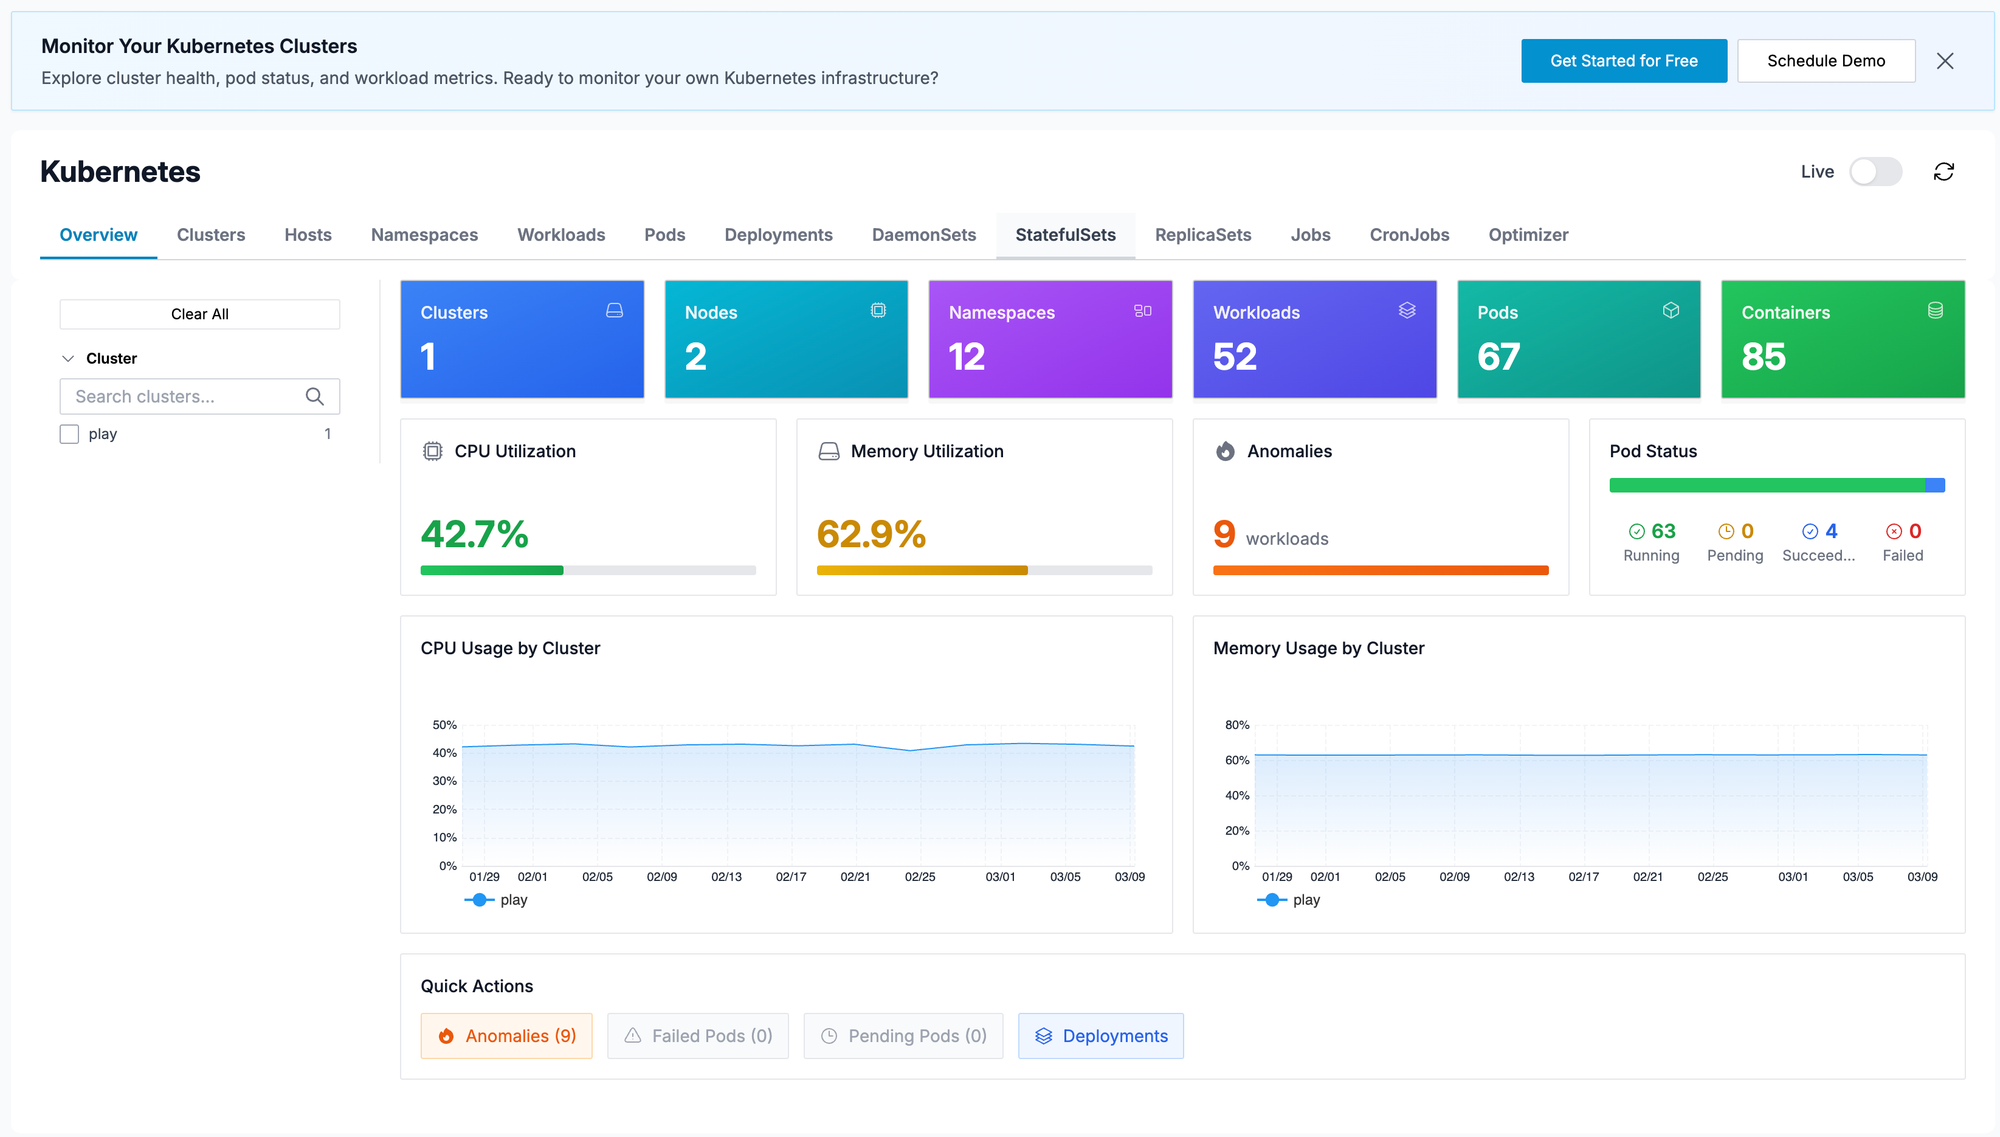
Developer experience. The UI stays responsive even under load, unlike the old Grafana setup. The Kubernetes view — clusters, pods, health across 20+ clusters — gives a single pane for infrastructure visibility.
"Going from the old setup to Oodle felt like going from a rudimentary product to a proper product."
— Sharva, CTO at Wisdom AI
AI as a force multiplier. The AI assistant and MCP server removed the expertise barrier from observability. Engineers who never learned PromQL now build dashboards and alerts in minutes. On-call engineers who used to spend 10–15 minutes hunting for logs now get them pushed to Slack automatically — or pull them into Cursor mid-debug without leaving their editor. The net effect: observability went from a platform team's burden to something every engineer uses daily, without training.
"AI analysis on alerts is powerful for identifying problematic nodes and patterns across service logs"
— Varun, Founding AI Engineer at Wisdom AI
Cross-customer and cross-cloud debugging. Queries that used to require custom scripts or were simply impossible — "which customers are seeing delayed responses?" or "is this tied to a specific LLM provider?" — are now standard. Run a query in Oodle with the right filters and dimensions. No more ad-hoc scripts. No more cross-account log scraping.
"We've run customer instances on AWS, Azure, and GCP, and it is painful to go to individual cloud consoles. Oodle helps with the multi cloud use case by offering a single pane of glass"
— Guilherme, Co-Founder at Wisdom AI
What's Next
Wisdom plans to deepen their use of DB monitoring and rely more on Oodle's AI features. They're also exploring LLM observability as their agentic product evolves — and we're building alongside them.