Building a High-Performance, Low-Cost Metrics Observability System

TL;DR
** We are live on HackerNews!**
We designed a serverless & cost-efficient metrics observability system that delivers fast performance at any scale.
- Try out our playground with 13M+ active time series/hr & 34B+ samples/day
- Explore all features with live data via Quick Signup
- Instant exploration (<5min): Run one command to stream synthetic metrics to your account
- Easy integration (<15min): Explore with your data from existing Prometheus or OTel setup.
Introduction
In today’s world, observability is essential for any company to understand how their systems are performing. It plays a crucial role in tracking business metrics, as well as monitoring the availability, reliability & performance of applications and infrastructure. More importantly, observability empowers teams to quickly detect, alert, and respond when systems deviate from expected behavior.
Observability is typically categorized into four primary types of data: metrics, logs, events, and traces, profiles - each serving distinct purposes. In this post, we will dive deep into metrics observability.
What is Metrics Observability?
Metrics observability focuses on time series data, which consists of labels (a set of <label_name, label_value>) and samples (a set of <timestamp, value>). These metrics can be visualized at a point in time or across a timeline to reveal trends and insights. For instance, you might monitor infrastructure metrics like CPU and memory usage, service metrics such as latency and error rates, or business-level metrics like the number of orders placed.
Key Requirements of Metrics Observability
Real-time
You should be able to see what is happening in the system right now.
Accurate
Data integrity is critical. Metrics should be collected without any data loss, and transformations should yield accurate results.
Fast
Queries should return results within seconds, enabling live debugging when issues arise.
Reduce MTTD / MTTR
One of the keys to running reliable systems is the ability to detect and fix issues quickly. You need to spot problems fast (MTTD) and resolve them just as quickly (MTTR). To do this effectively, you should have the ability to explore your metrics in-depth—filtering by any tag, no matter the cardinality. This flexibility helps you pinpoint root causes faster and keeps your systems running smoothly.
Highly Available
Your observability platform must be highly available and reliable - especially during outages, as downtime in your observability system during a critical incident can worsen the situation.
Simple and Compatible
A good observability platform is easy to use and integrates seamlessly with your existing tools, with no vendor lock-in.
Typical Challenges in Metrics Observability
While there are several open-source solutions (like Prometheus) and managed platforms available today, some key challenges have emerged over the years:
Scaling
Adding more dimensions to improve drill-down capabilities can rapidly lead to a significant spike in captured metrics. For example, with the rise of microservice architectures, the sheer volume of metrics has skyrocketed as pods and containers continuously cycle. Similarly, SaaS platforms that demand per-customer visibility add another layer of complexity, drastically multiplying the number of metrics being tracked.
Many platforms struggle to handle this growth efficiently, becoming either cost-prohibitive or unable to scale effectively.
Cost
Many observability vendors distinguish between infrastructure/integration metrics and custom metrics. Unfortunately, custom metrics can be prohibitively expensive, discouraging their usage.
In a bid to manage costs, companies often block or downsample metrics, reducing the depth and resolution of their observability, which inherently increases business risks, especially during critical investigations by increasing MTTR.
Performance
As the volume of data increases or the time range of queries extends, many observability systems begin to slow down. This can severely impact the ability to quickly debug issues.
Our Solution: Separating Storage from Compute
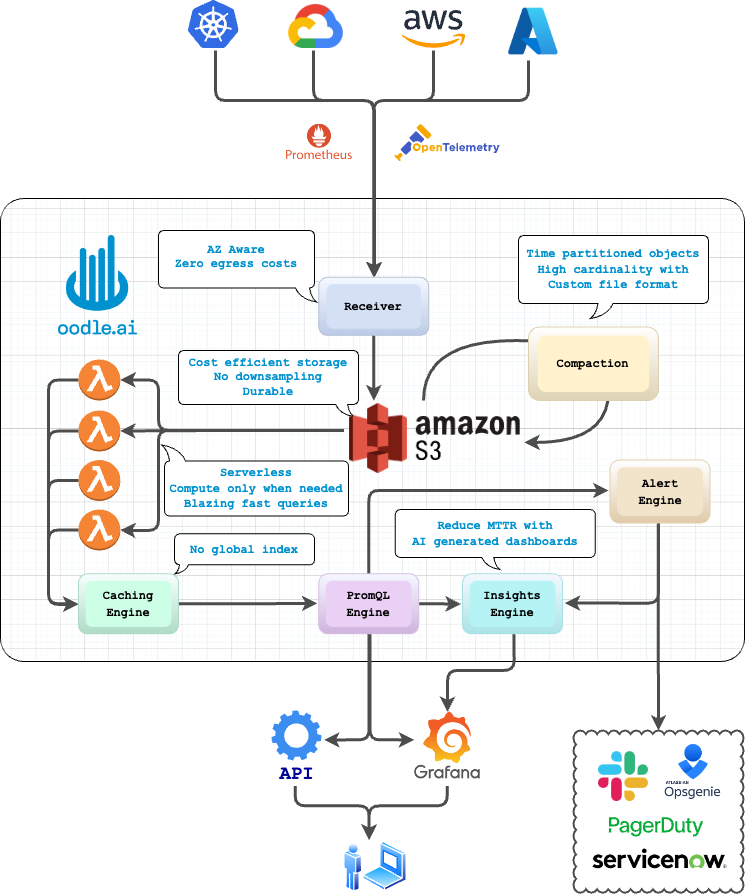
At oodle.ai, we separate storage and compute for metrics observability. This allows us to scale both compute and storage independently, ensuring high performance at a significantly lower cost.
Compute
Traditional systems over-provision compute resources to handle peak loads, often leading to unnecessary costs. While some systems use auto-scaling to manage this, auto-scaling isn't fast enough for real-time observability needs.
Serverless functions, like AWS Lambda, are a game-changer. They provide on-demand compute that scale instantly. AWS has recently improved the performance and cost of Lambda, making it ideal for this use case.
With serverless functions, compute costs are reduced as you only pay for what you use. Query performance improves because queries can be broken down and parallelized across serverless instances.
Storage
Traditional metrics observability systems use SSDs with 2 or 3-way replication, which is both costly and redundant.

By using object storage like S3, which is significantly cheaper, we can store incoming data directly, reducing costs by 10x compared to SSD-based storage. This also means we can retain high-fidelity data for extended periods without downsampling.
Additionally, by partitioning our data and using a custom format for storing indexes alongside the data on S3, we get significantly higher query performance without the memory overhead of traditional global indexes.
S3 offers 99.999999999% durability, protecting against data corruption and loss.
Networking / Egress Costs
Networking costs are often the invisible elephant in the room. Moving data across availability zones (AZ) or regions in the cloud introduces significant egress costs. Most observability systems replicate data across zones, inadvertently raising these costs.
Our AZ-aware architecture eliminates these networking and egress costs by ensuring that data scraping and ingestion occur within the same availability zone. Our architecture is built to ensure seamless operations even during availability zone failures, leveraging object storage and stateless compute for enhanced resilience.
Summary
Building an observability system from scratch isn’t always the right call. But in this case, it absolutely is. By applying first principles to observability, we’ve developed a platform that effortlessly scales to handle more than 1 billion time series per hour while being orders of magnitude more cost-efficient than current solutions.
With our solution - combined with open-source protocols like OpenTelemetry, Prometheus Remote Write, and visualization tools like Grafana - you get a complete end-to-end observability platform.
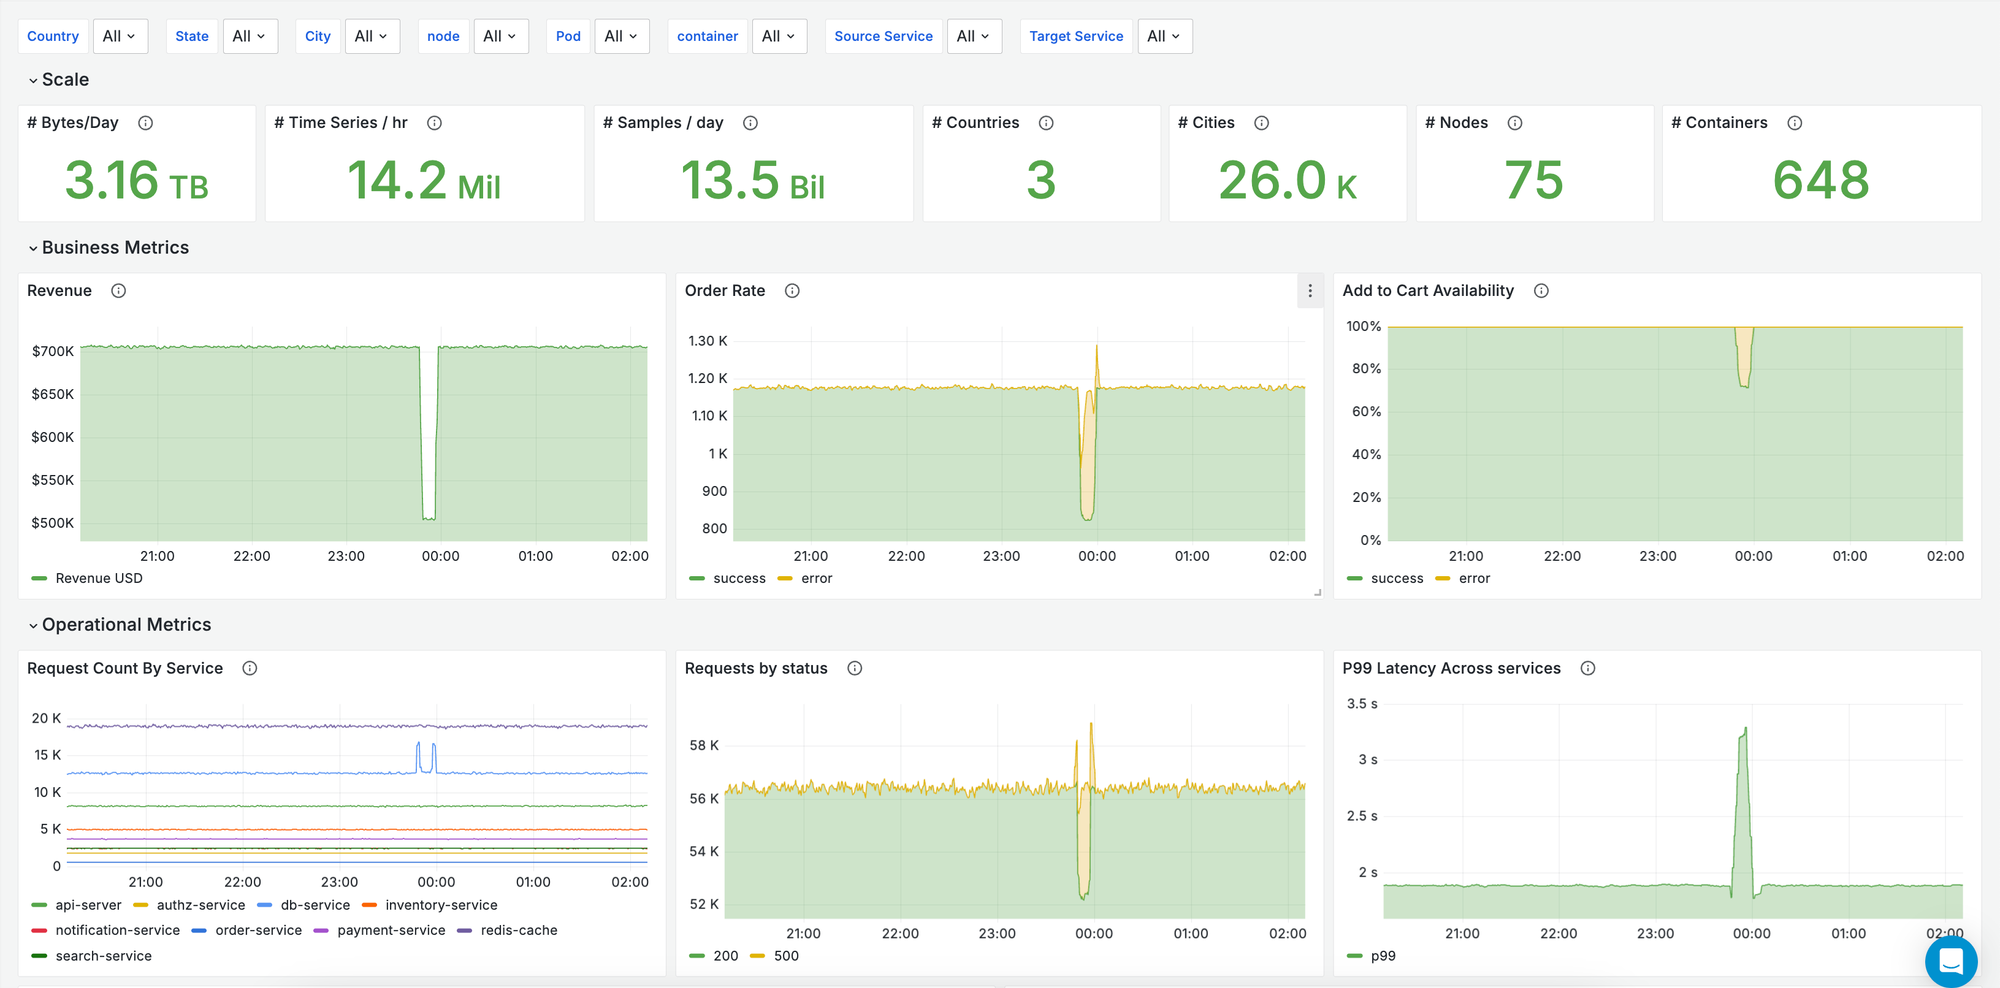
Try out our high-scale playground at play.oodle.ai! The playground ingests 13M+ active time series per hour and more than 13B+ data samples per day.
Explore all features with live data with a Quick Signup